Category Archives: math

Detecting Anomalies in Correlated Time Series

3 Comments

anomaly in time series correlation

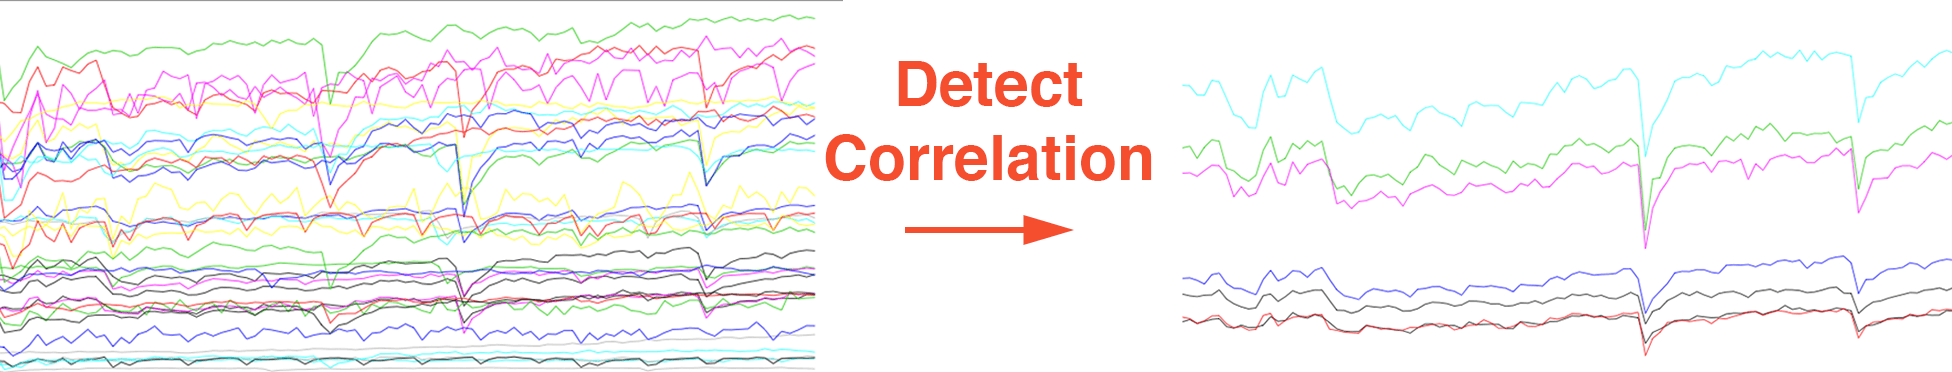
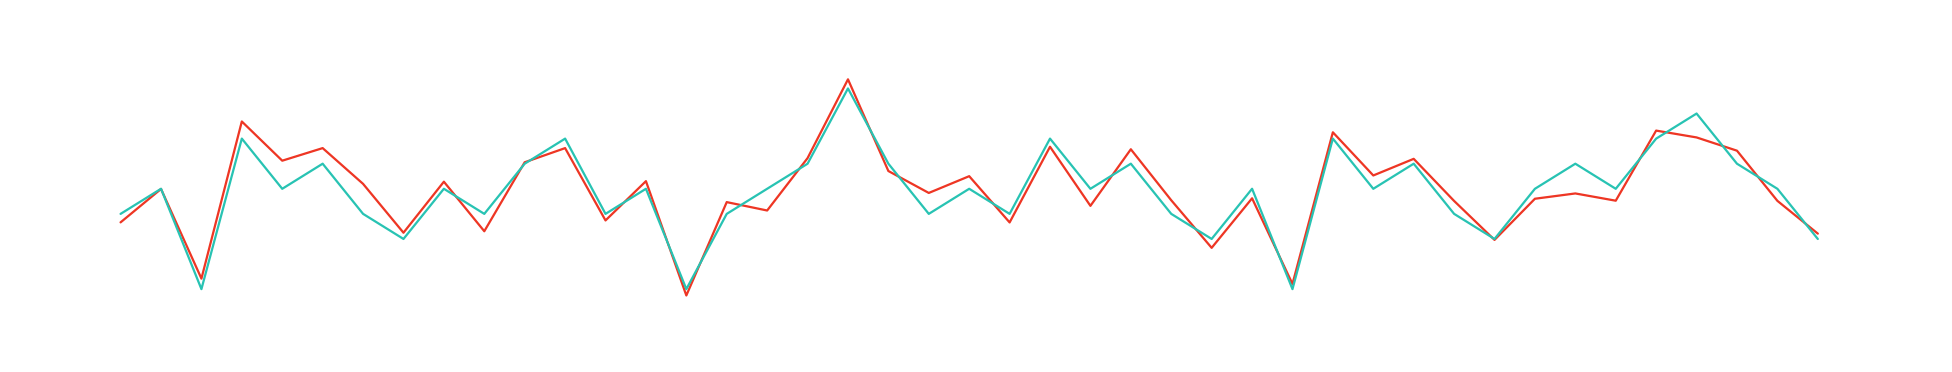
Monitoring key performance indicators (KPIs), sales or any other product data means working within an ecosystem where very often you will see metrics correlating with each other. When a normal correlation between two metrics is broken, we have reason to suspect something strange is happening.

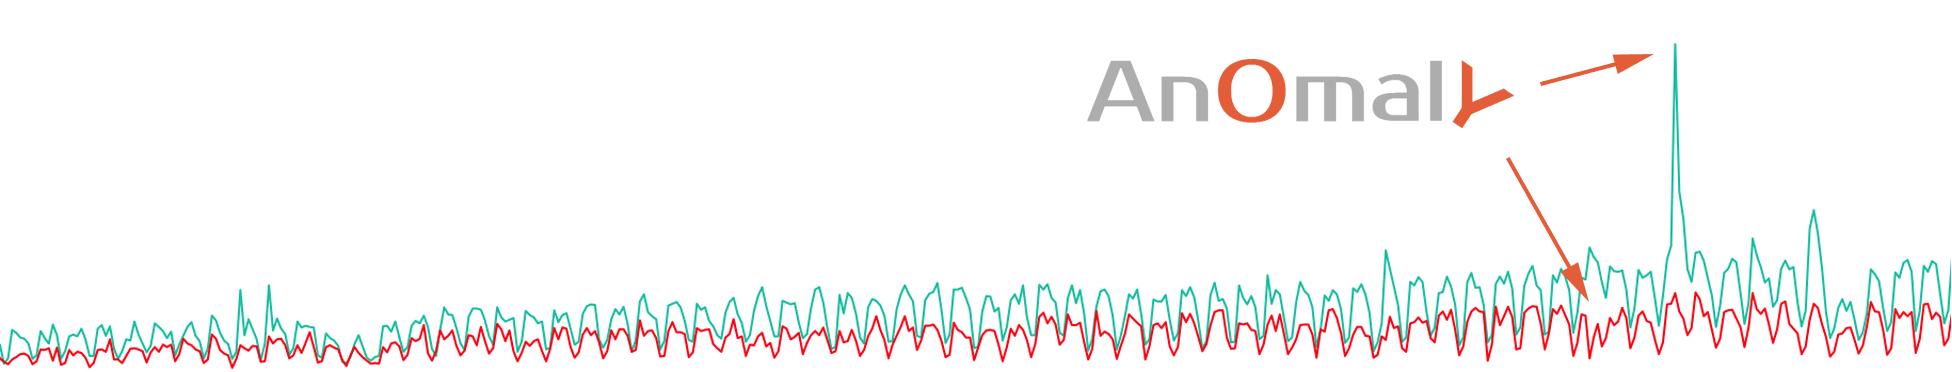
As an example, take a look at anomaly.io analytics during its early days (a long time ago). In the graphic above, the new users are shown in green and the returning users in red. Clearly, something strange happens in the middle of November. Let’s use some techniques to find out more!
Read More

Moving Median is Robust to Anomalies

No Comments

moving-median

It can be difficult to detect the underlying trend of a time series in the presence of anomalies, due to unwanted noise. Fortunately, there are techniques to take into account those anomalies, so you can work with this kind of time series. One of them is the moving median.

Read More

Detecting Seasonality Using Fourier Transforms in R

5 Comments

detect seasonality

Our brains are really fast at recognizing patterns and forms: we can often find the seasonality of a signal in under a second. It is also possible do this with mathematics using the Fourier transform.

First, we will explain what a Fourier transform is. Next, we will find the seasonality of a website from its Google Analytics pageview report using the R language.

Read More

Anomaly Detection Using K-Means Clustering

One Comment

kmean anomaly

Monitored metrics very often exhibit regular patterns. When the values are correlated with the time of the day, it’s easier to spot anomalies, but it’s harder when they do not. In some cases, it is possible to use machine learning to differentiate the usual patterns from the unusual ones.

Read More

help with term papers