We previously tested Twitter Anomaly Detection package using the R language. Now let’s take a look at Twitter Breakout Detection.
What is Twitter Breakout Detection?
This Twitter package is intended to detect changes in time series. It is describe as an E-Divisive with Medians (EDM). It is supposed to:
- Detect divergence (mean shift, ramp up)
- Detect changes in distribution
- Work 3.5× faster than other breakout detection methods
- Be robust in the presence of anomalies
To detect divergence the algorithm uses a clustering technique (mean shift clustering). As EDM is non-parametric, the data doesn’t need to follow any specific distribution; it can adapt to the current distribution. As a result, it can be used to detect when the distribution changes.
We previously explained how moving medians are robust to anomalies. The 3.5x speed improvement compare to E-Divisive is in part due to the use of Interval Trees to approximate the median very efficiently. However, this isn’t the only reason for the speed increase.
Let’s try it out ourselves.
Divergence Detection (Mean Shift, Ramp Up)
Mean Shift
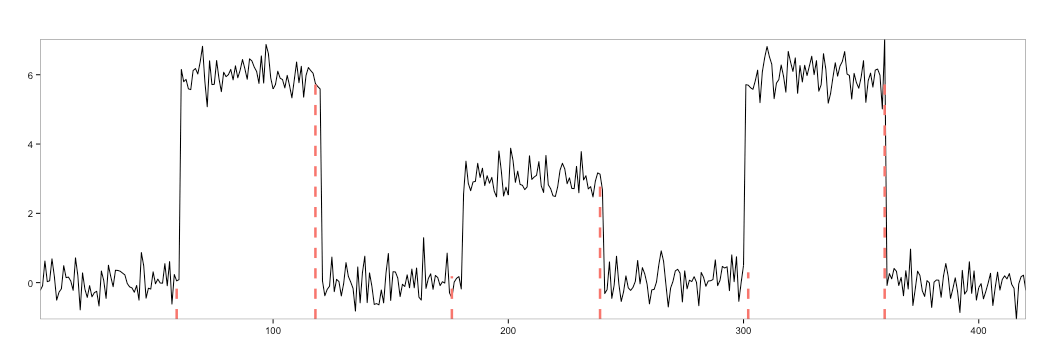
A sudden jump in the time series is call a mean shift and represents the time series switching from one steady state to another. A good example (used by Twitter) is to imagine CPU utilization suddenly jumping from 40% to 60%. Let’s generate a fake time series to test the detection process.
1 2 3 4 5 6 7 8 9 10 11 12 13 14 15 16 17 18 | # install BreakoutDetection install.packages("devtools") devtools::install_github("twitter/BreakoutDetection") library(BreakoutDetection) set.seed(123) p1 = rnorm(60, mean = 0, sd = .4) p2 = rnorm(60, mean = 6, sd = .4) p3 = rnorm(60, mean = 0, sd = .4) p4 = rnorm(60, mean = 3, sd = .4) p5 = rnorm(60, mean = 0, sd = .4) p6 = rnorm(60, mean = 6, sd = .4) p7 = rnorm(60, mean = 0, sd = .4) all = c(p1,p2,p3,p4,p5,p6,p7) plot(as.ts(all), col = "#27ccc0", lwd = 4) res = breakout(all, min.size=20, method='multi', beta=.001, degree=1, plot=TRUE) res$plot |

Indeed, we were able to detect 7 mean divergences, also called break downs.
A simple help(breakout) command tells us more about the package.
min.size: The minimum number of observations between change points.
method: Method must be one of either “amoc” (At Most One Change) or “multi” (Multiple Changes). For “amoc.” at most one change point location will be returned.
degree: The degree of the penalization polynomial. Degree can take the values 0, 1, and 2. The default value is 1.
beta: A real number constant used to further control the amount of penalization. This is the default form of penalization; it will be used if neither beta nor percent are supplied. The default value is beta=0.008.
Ramp Up
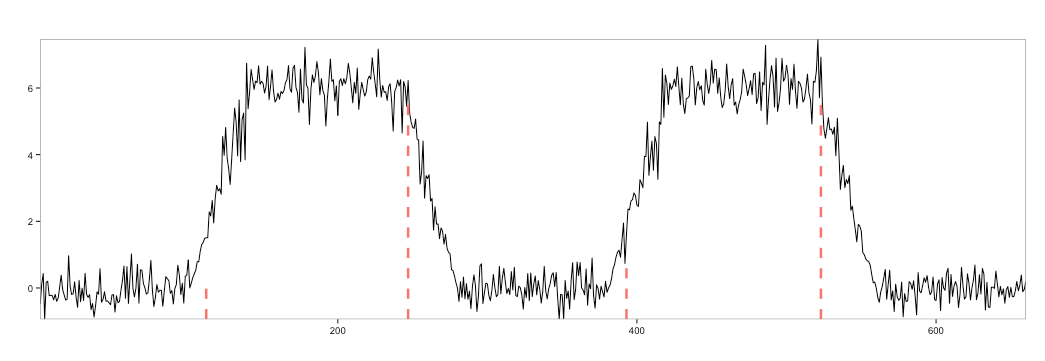
A ramp up is a slow transition from one steady state to another. An example would be CPU utilization slowly transitioning from 40% to 60% over time. Let’s detect this kind of divergence.
1 2 3 4 5 6 7 8 9 10 11 12 13 14 15 16 | ramp = 40 set.seed(1234) p1 = rnorm(100, mean = 0, sd = .4) p2 = rnorm(ramp, mean = 6, sd = 1) * seq(0, 1, length.out = ramp) p3 = rnorm(100, mean = 6, sd = .4) p4 = rnorm(ramp, mean = 6, sd = 1) * seq(1, 0, length.out = ramp) p5 = rnorm(100, mean = 0, sd = .4) p6 = rnorm(ramp, mean = 6, sd = 1) * seq(0, 1, length.out = ramp) p7 = rnorm(100, mean = 6, sd = .4) p8 = rnorm(ramp, mean = 6, sd = 1) * seq(1, 0, length.out = ramp) p9 = rnorm(100, mean = 0, sd = .4) all = c(p1,p2,p3,p4, p5,p6,p7,p8,p9) plot(as.ts(all), col = "#27ccc0", lwd = 2) res = breakout(all, min.size=20, method='multi', beta=.001, degree=1, plot=TRUE) res$plot |

Even with the ramp up, breakdown still detects 7 distinct states. It’s very powerful to be able to see the ramp up as a transition and not as a breakdown.
Detect Changes in Distribution
EDM doesn’t make assumptions about the distribution of the time series. Instead, it learns the current distribution and uses it as a reference. When the distribution suddenly changes, EDM can detect the variation.
1 2 3 4 5 6 7 8 9 10 11 12 13 14 | set.seed(123456) p1 = rnorm(1000, mean = 1) p2 = rgamma(1000, shape = 1) p3 = rpois(1000, lambda = 3)/2 - .5 p4 = runif(1000) + .5 p5 = rexp(1000) p6 = rweibull(1000, shape = 1) all = c(p1, p2, p3, p4, p5, p6) plot(as.ts(all)) abline(v=seq(100,1000*6,100),col="blue") res = breakout(all, min.size=200, method='multi', beta=0.00018, degree=1, plot=TRUE) res$plot |

In the example above we switch alternatively from the Normal distribution to the Gamma, Poisson, Uniform, Exponential and Weibull distributions. With some (difficult) fine tuning, EDM can detect the change from Normal to Gamma distributions and from Uniform to Exponential. Unfortunately, it doesn’t detect the change from Poisson to Uniform distribution or from Exponential to Weibull. We believe that this is due to its ability to perform in the presence of anomalies as the running Median removes outliers. Without anomalies, E-Divisive performs better. The blue line shows where E-Divisive notifies that there has been a change in distribution.
1 2 3 4 5 6 7 8 | #install package install.packages("ecp") library(ecp) # ~ 30 min on 2.6Ghz CPU ediv = e.divisive(as.matrix(all), min.size=200, alpha=1) plot(as.ts(all)) abline(v=ediv$estimates,col="blue") |

3.5× Greater Speed Than Other Breakout Detection Methods
E-Divisive detects changes in distribution as soon as they occur, but is very slow compared to the EDM algorithm. One of the reasons why EDM is much faster is due to the use of interval trees to approximate the median.
| Data points | E-Divisive | EDM |
| 6000 | 29 min | 24 s |
| 600 | 7 s | 1 s |
Based on only two tests, we can see that EDM performs much faster than E-Divisive.
Robustness in the Presence of Anomalies
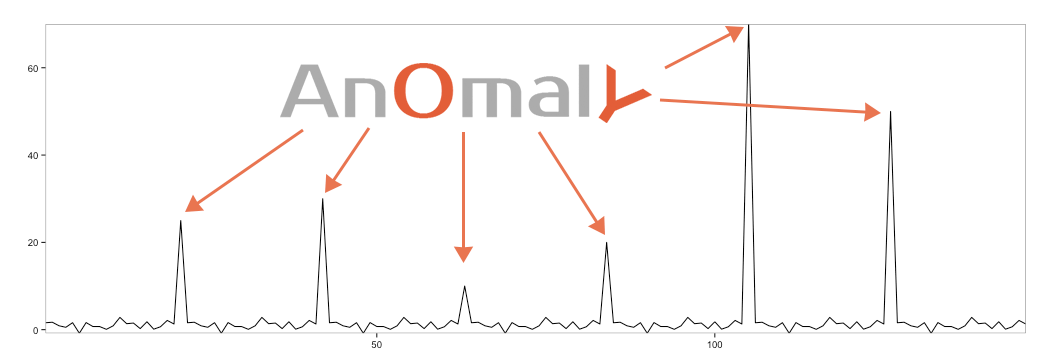
As explained earlier, EDM stand for E-Divisive with Medians. In a previous article, we showed how the running median is robust to anomalies. As a result, an anomaly in the time series isn’t detected as a mean shift.
1 2 3 4 5 6 | set.seed(12345) p = rnorm(20, mean = 1) all = c(p, 25, p, 30, p, 10, p, 20, p, 70, p , 50, p) #Add Anomalies res = breakout(all, min.size=40, method='multi', beta=0.001, degree=1, plot=TRUE) res$plot |

Anomalies aren’t detected as “breakouts” or mean shifts. EDM is, indeed, robust to anomalies.
Monitor & detect anomalies with Anomaly.io
SIGN UP

 sending...