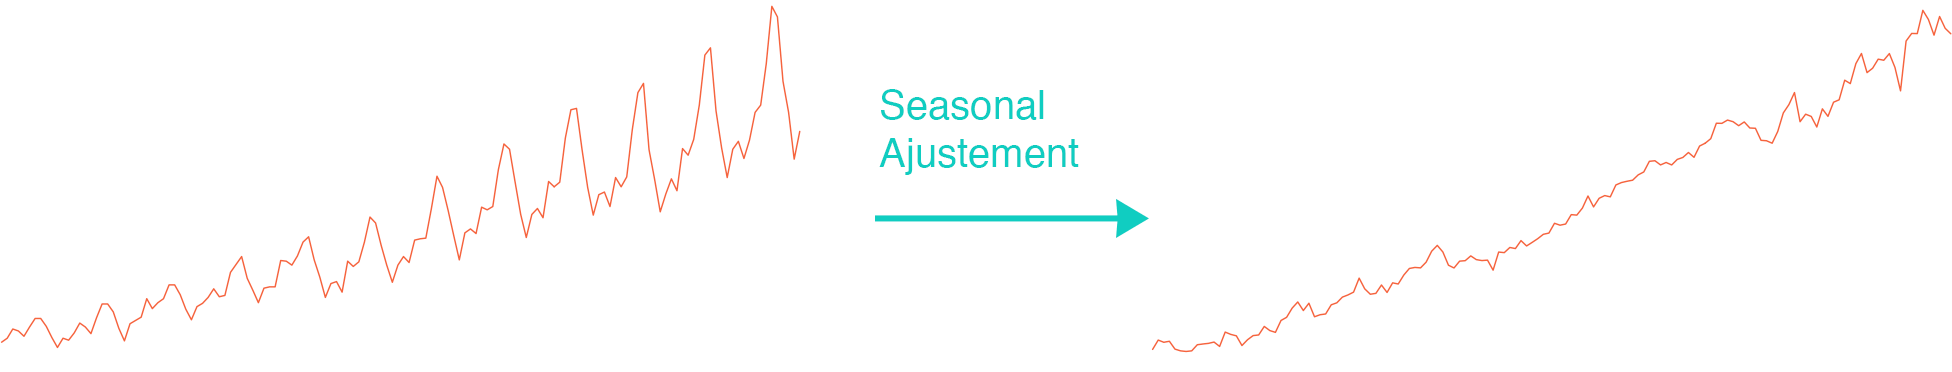
What is seasonal adjustment? Why is it important, and when should we use it? How should it be done? In this article, we will answer these and many other questions related to seasonality in data.
Why Seasonally Adjust Data ?
Many industries experience fluctuations in various metrics based on the time of year. This means that it is not possible to effectively assess performance by comparing data from one time of year to data from another. Furthermore, these seasonal fluctuations can sometimes be so large that they can mask important business trends hiding in the data.
Consider the sales of an ice cream parlor, for example. It is normal for this sort of business to have higher sales during the warm summer months than during the winter, so you cannot compare January’s sales figures to those from July. Furthermore, the oscillations due to seasonality can be so large that they make business trends hard to see. If sales are up in the most recent month of July, for example, was this due to seasonal variation or an actual increase in sales? To get these answers we need to remove “seasonality” from the data, a process called seasonal adjustment.
Airline Passenger Numbers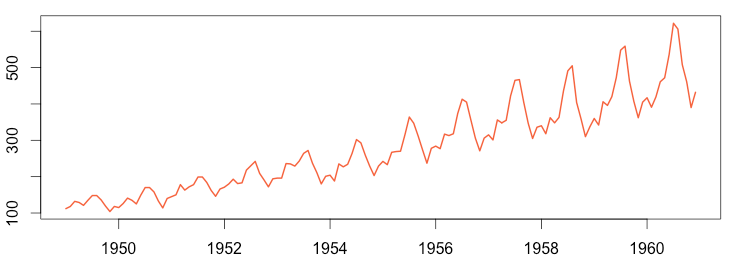
Airline Passenger Numbers – Seasonally Adjusted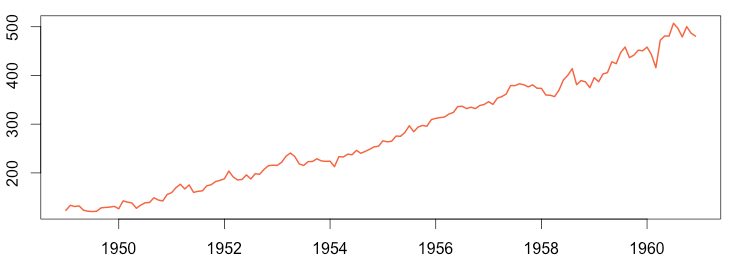
The images above show airline passenger numbers from 1949 to 1960. The chart on the left shows the raw data, which illustrates substantial seasonality: people travel more in the summer. The seasonal variations make it difficult to observe potentially noteworthy fluctuations. The seasonally adjusted chart on the right has removed the seasonal patterns from the raw data, allowing us to see the actual trend in passenger activity over time. In so doing, we’ve exposed an anomaly in the year 1960 that was not readily noticeable in the raw data.
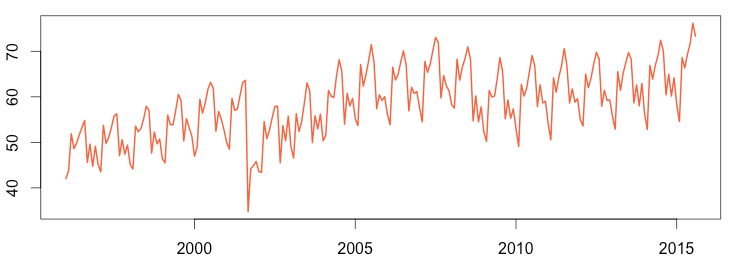
Airline Passenger Numbers
Airline Passenger Numbers – Seasonally Adjusted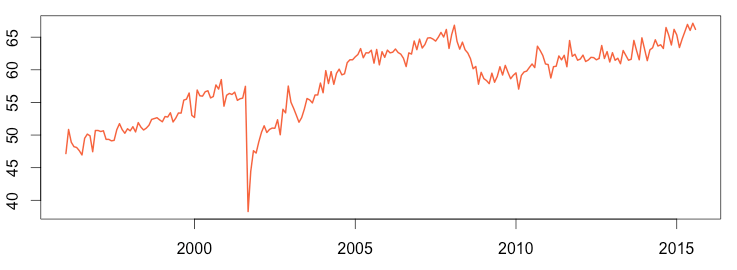
Sometimes an anomaly is so large that it is obvious even in the raw data. For example, the graph above left shows airline passenger numbers from 1996 to 2015. The severe drop in late 2001 was due to the 9/11 attack on the United States, which caused all of North American air space to be closed for several days. But the seasonally adjusted time series on the right makes some more subtle variances easier to see, such as the dip starting in 2008 caused by the Great Recession.
How to Seasonally Adjust Time Series
To seasonally adjust a time series we must first find the seasonality. Performing a time series decomposition will “break down” a time series into multiple sub-time series, one of which will contain the seasonality. The decompose( ) function in R does the heavy lifting here, but there are two requirements to use this function:
- You must know if you’re dealing with an additive or multiplicative model; read about time series decomposition to know which one to use.
- You must know the period of the seasonality. This may be a fixed period such as daily, weekly, monthly, or yearly. If unknown, it is also possible to detect the seasonality mathematically.
Another article can help you understand how to perform a time series decomposition by explaining seasonal adjustment formulas:
Additive:
Seasonally Adjusted = Time series – Seasonal
Multiplicative:
Seasonally Adjusted = Time series / Seasonal
1 2 3 4 5 6 7 8 | install.packages("fpp") library(fpp) data(ausbeer) ts_beer = ts(ausbeer, frequency = 4, start = 1956) decompose_beer = decompose(ts_beer, "additive") adjust_beer = ts_beer - decompose_beer$seasonal plot(adjust_beer) |
This seasonality is annual with four data points per years (frequency = 4). As an example, here is the seasonally adjusted time series for Australian beer production:
Australian Beer Production – Seasonally Adjusted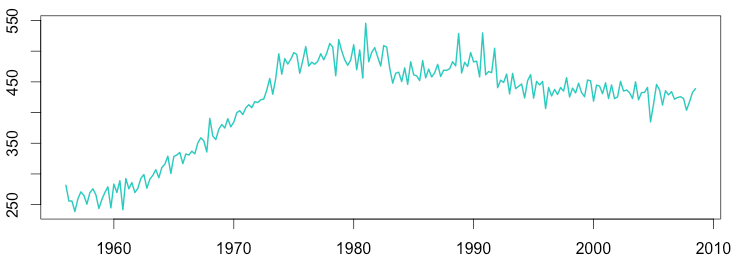
1 2 3 4 5 6 7 8 | install.packages("Ecdat") library(Ecdat) data(AirPassengers) ts_air = ts(AirPassengers, frequency = 12, start = 1949) decompose_air = decompose(ts_air, "multiplicative") adjust_air = ts_air / decompose_air$seasonal plot(adjust_air, col = color, lwd = 2) |
This is annual seasonality with 12 data points per year (frequency = 12). Here again, as an example, is the seasonally adjusted time series for airline passengers:
Airline Passenger Numbers – Seasonally Adjusted
Conclusion
Seasonally adjusted time series provide a way to understand the underlying trends in data by removing the “noise” of seasonal fluctations so outliers and anomalies are easier to see. Just as removing seasonality makes problems easier to spot with your eyes, it also makes them easier for the computer. This is one of many techniques we use at Anomaly.io to automatically detect problems in monitored data.
Monitor & detect anomalies with Anomaly.io
SIGN UP sending...