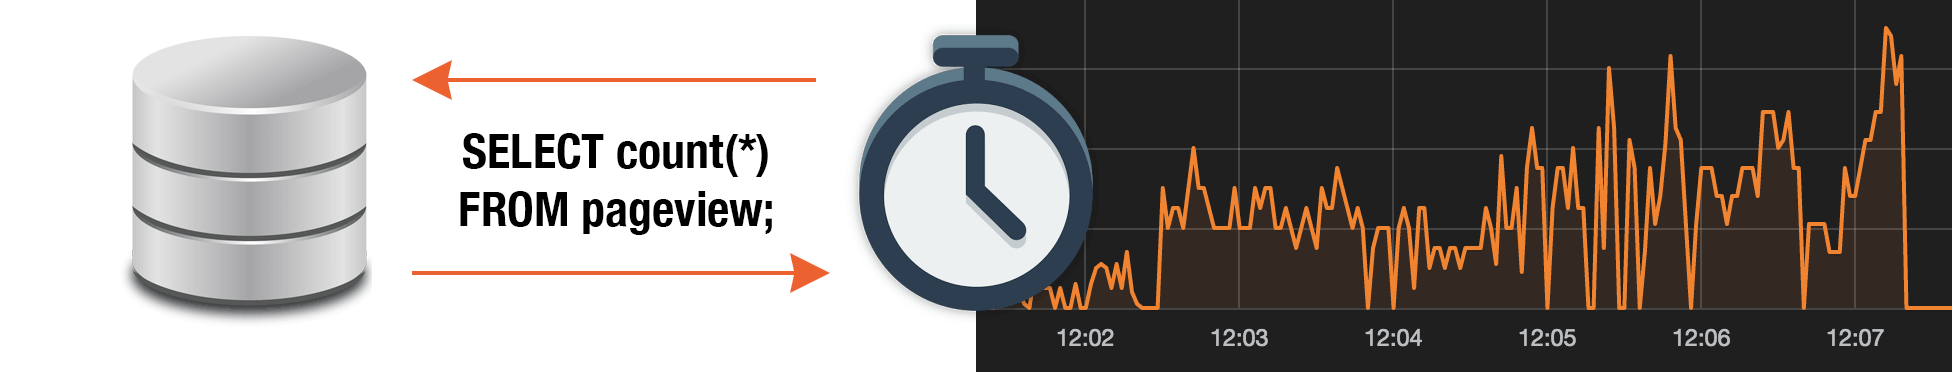
The CollectD DBI Plugin executes custom SQL queries to generate metrics from most relational databases. Over any interval of time, the result of SQL requests such as “SELECT count(*) FROM pageview” is reported. The difference between successive call results is the number of events recorded in the database over the specified time period.
Because it’s widely used, MySQL will be used for this example, but this also works for:
- MariaDB
- PostgreSQL
- Oracle (using Oracle Plugin)
- and more
DBI Plugin Example
On our website, each time a user performs a pageview, edit or postcomment action we save it in the interaction table. A user can belong to one of the groups admin, user or guest. Using CollectD DBI Plugin and some custom SQL requests, we can monitor what is happening in our MySQL database.
1 2 3 4 5 6 7 8 9 10 11 12 13 14 15 16 17 | SELECT event_type, count(user_id) AS value FROM interaction GROUP BY event_type; +-------------+-------+ | event_type | value | +-------------+-------+ | edit | 1 | | pageview | 8 | | postcomment | 2 | +-------------+-------+ SELECT 'visitor.pageview' as c_key , count(*) AS c_value FROM interaction WHERE event_type = "pageview"; +------------------+---------+ | c_key | c_value | +------------------+---------+ | visitor.pageview | 8 | +------------------+---------+ |
(Optional) To get the exactly same result, download the database dump and import in MySQL:
1 2 3 4 5 6 7 8 9 10 11 12 13 14 15 16 17 18 19 20 21 22 | $ mysql --user=root -p mysql> create database mydb; mysql> exit $ mysql --user=root -p mydb < import.sql $ mysql --user=root -p mysql> use mydb; mysql> SELECT * FROM interaction; +---------+------------+-------------+---------------------+ | user_id | group_name | event_type | event_date | +---------+------------+-------------+---------------------+ | 1 | admin | edit | 2015-05-25 15:45:14 | | 1 | admin | pageview | 2015-05-25 15:45:14 | | 1 | admin | postcomment | 2015-05-25 15:45:14 | | 2 | user | pageview | 2015-05-25 15:45:14 | | 2 | user | pageview | 2015-05-25 15:45:14 | | 2 | user | pageview | 2015-05-25 15:45:14 | | 3 | user | pageview | 2015-05-25 15:45:14 | | 3 | user | postcomment | 2015-05-25 15:45:14 | | 4 | guest | pageview | 2015-05-25 15:45:14 | | 5 | guest | pageview | 2015-05-25 15:45:14 | | 5 | guest | pageview | 2015-05-25 15:45:14 | +---------+------------+-------------+---------------------+ |
Executing both SQL requests every second produces new monitoring metrics:
- event_type.edit
- event_type.pageview
- event_type.postcomment
- visitor.pageview
Install Plugin DBI for CollectD
To query our MySQL database with Plugin DBI we will need to recompile CollectD with some extra dependencies:
1 2 3 4 5 6 7 | apt-get install libdbi-dev apt-get install libdbd-mysql # For other databases # apt-get install libdbd-pgsql # apt-get install libdbd-sqlite # apt-get install libdbd-sqlite3 |
After the dependencies are installed, install CollectD as usual:
- Tutorial: Install CollectD on Ubuntu / Debian
- Tutorial: Install CollectD on CentOS / Fedora
During CollectD compilation ./configure you should see:
1 2 3 4 5 6 | [...] curl . . . . . . . . no curl_json . . . . . . no curl_xml . . . . . . no dbi . . . . . . . . . yes [...] |
Configure and Start the Plugin DBI
Edit the CollectD configuration, usually located at /opt/collectd/etc/collectd.conf
1 2 3 4 5 6 7 8 9 10 11 12 13 14 15 16 17 18 19 20 21 22 23 24 25 | <Query "interaction_stats"> Statement "SELECT event_type, count(user_id) AS value FROM interaction GROUP BY event_type" Type "gauge" InstancesFrom "event_type" ValuesFrom "value" <Query "pageview"> Statement "SELECT 'visitor.pageview' as c_key ,count(*) AS c_value FROM interaction WHERE event_type = 'pageview'" Type "gauge" InstancesFrom "c_key" ValuesFrom "c_value" <Database "sessionmetrics"> Driver "mysql" DriverOption "host" "localhost" DriverOption "username" "root" DriverOption "password" "mypassword" DriverOption "dbname" "mydb" Query "interaction_stats" Query "pageview" |
Now restart CollectD:
1 2 3 4 5 | $ # using systemd $ service collectd restart $ $ # or manually $ /opt/collectd/sbin/collectd -C /opt/collectd/etc/collectd.conf |
For troubleshooting, add this configuration:
1 2 3 4 | LoadPlugin logfile LogLevel info File STDOUT |
And start CollectD in the foreground:
1 2 3 | $ $ /opt/collectd/sbin/collectd -C /opt/collectd/etc/collectd.conf -f $ |
Metrics Dashboard
Optional: You don’t have to use InfluxDB/Grafana. CollectD integrates with many time series databases. It is fairly easy to integrate with different time series databases / monitoring dashboards.
Fake some user activity in MySQL:
1 2 | INSERT INTO `interaction` (`user_id`, `group_name`, `event_type`) VALUES (4, 'guest', 'pageview'); |
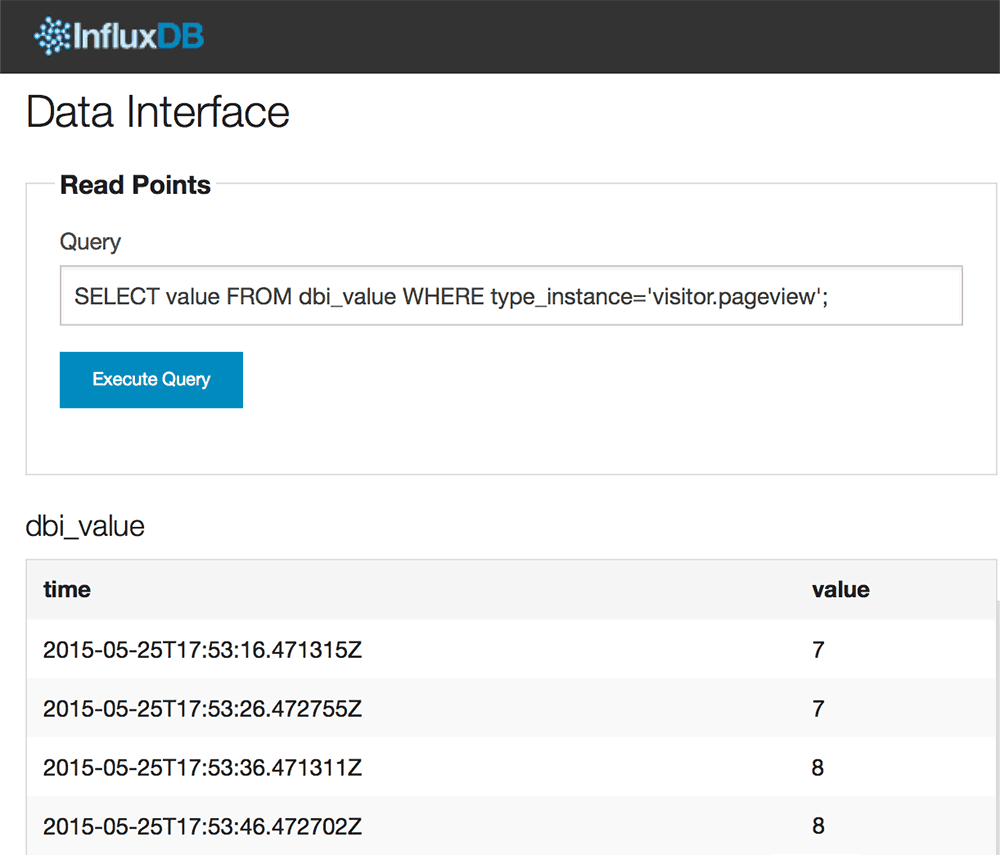
With more pageviews, the value should increase:
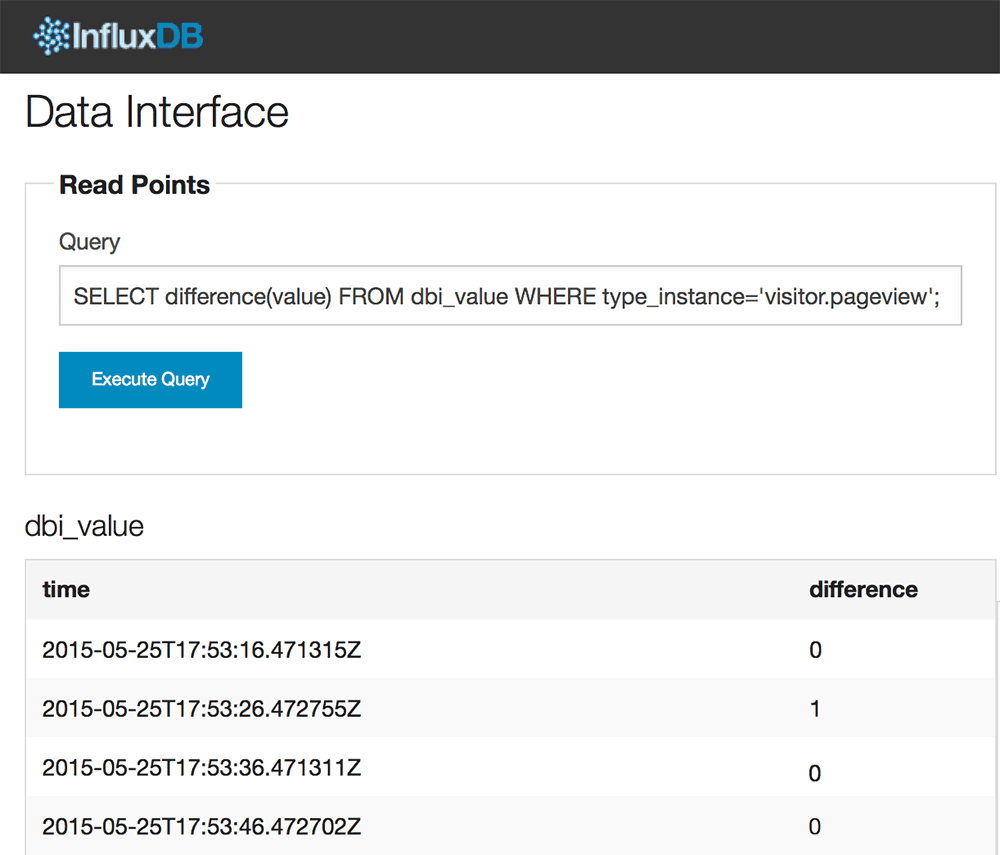
We can use InfluxDB DIFFERENCE aggregator to highlight events accruing in real time.
Open the Grafana web UI. Replicate the InfluxDB request:
SELECT difference(value) FROM dbi_value WHERE type_instance=’visitor.pageview’ AND $timeFilter GROUP BY time($interval) ORDER ASC;
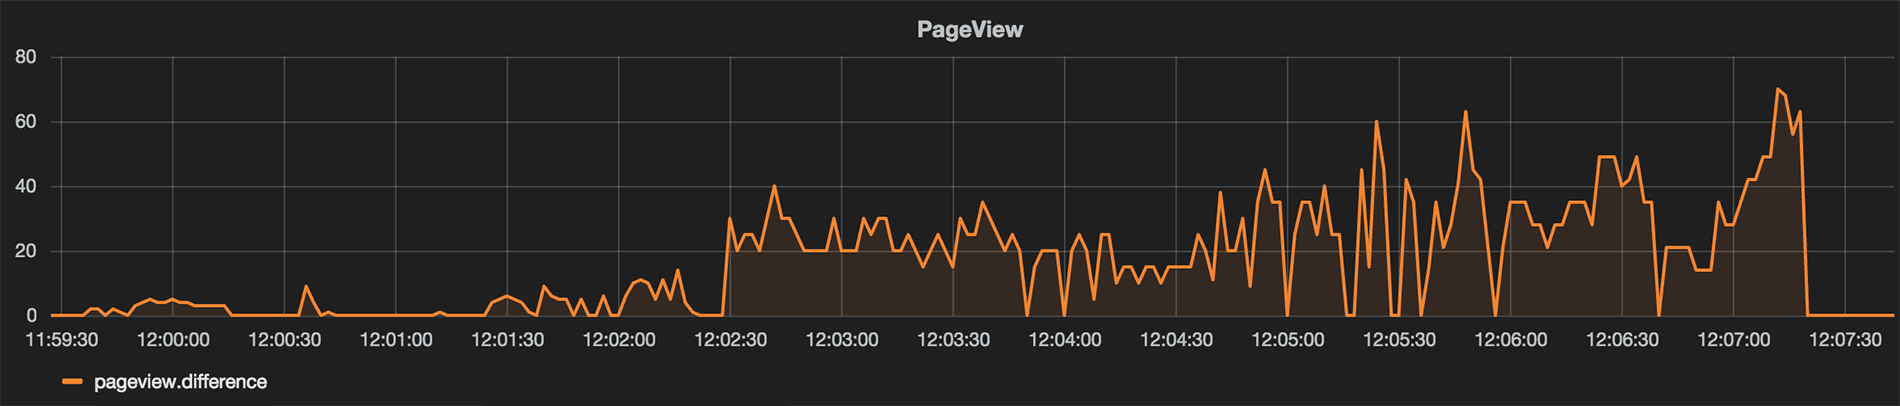
Done! We can watch our pageviews per second update in real time. Proceed the exact same way for the postcomment, pageview and edit metrics.
Conclusion
Code monitoring with StatsD is easy to install and configure. It’s even easier since CollectD now embeds a StatsD implementation.
But making code changes is a bit painful.
With CollectD DBI Plugin, it becomes possible to monitor an application, or at least its output, without any code changes. Any SQL request that generate numbers can be used to produce new metrics.
It is definitively a good starting point into application monitoring since it requires no code changes. However, it can also be considered an advance technique for monitoring what’s really happening within the database.
Monitor & detect anomalies with Anomaly.io
SIGN UP sending...