Since version 5.4, CollectD implements the StatsD network protocol. This means that you might not need to run two separate processes anymore.
About StatsD in CollectD
StatsD and CollectD are complementary monitoring solutions:
- Stats is an event counter/aggregation service. Simply send events to this external service to monitor your own code. The aggregated events are periodically sent to a database.
- CollectD is a statistics collection daemon. It periodically polls various sources, such as your OS, CPU, RAM, and network, but also many databases and software.
StatsD is also “embedded” into CollectD since v5.4 with the StatsD plugin. CollectD can now act as a StatsD process.
Requirements
- CollectD installed
- Tutorial: How to install CollectD on Debian / Ubuntu
- Tutorial: How to install CollectD On CentOS / Fedora
Install StatsD Plugin for CollectD
Edit the CollectD configuration file usually located at /opt/collectd/etc/collectd.conf
Uncomment or add StatsD plugin and configuration:
1 2 3 4 5 | LoadPlugin statsd Host "0.0.0.0" Port "8125" DeleteSets true |
Don’t forget to restart CollectD:
1 2 3 | $ $ service collectd restart $ |
- Host “0.0.0.0”: Listen to any IP. Change to “127.0.0.1” to only allow localhost to send metrics.
- port 8125: Where StatsD metrics will be received.
- DeleteSets true: The values of type sets metrics will not be sent if they didn’t change since the last interval.
Read more about StatsD plugin configuration.
Calling CollectD StatsD
Many StatsD client libraries exist in various programming languages. Pick your favorite and call StatsD on port 8125. It’s also possible to call the plugin from the command line:
1 2 3 4 | $ $ echo "my.own.metric:1|c" | nc -w 1 -u 127.0.0.1 8125 $ echo "my.own.metric:4|c" | nc -w 1 -u 127.0.0.1 8125 $ |
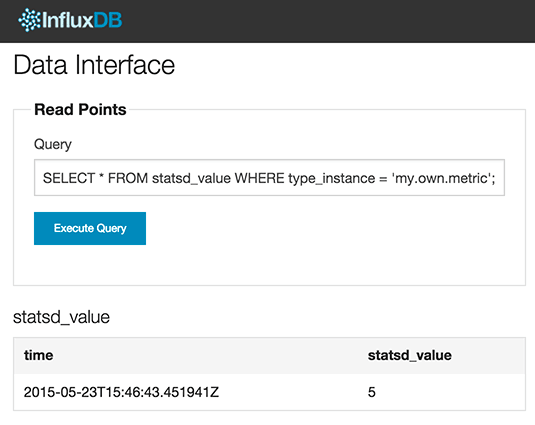
If, like us, your CollectD sends its metrics to InfluxDB, you should see the values in your database.
Calling both commands:
- Within the interval will result in an aggregate value of 5
- Out of the interval will result in two values: 4 and 1

Conclusion
StatsD is a very clever idea implemented in simple software. It behavior was replicated in 730 lines of C.
This Plugin is stable and was able to achieve 50k events per second on commodity hardware. If you already run CollectD and don’t need to run StatsD at scale it is highly recommended that you use this plugin to save yourself the pain of running both services.
Monitor & detect anomalies with Anomaly.io
SIGN UP

 sending...