
StatsD is a statistic aggregation tool written in node.js. It is a simple, yet powerful, tool for counting and timing when monitoring. StatsD makes it very easy to monitor your own code. Read More
Our weather follows typical patterns over the course of a year: in most places, it is cold in the winter and hot in the summer. Based on historical records we can detect unusual weather. Read More

Wikipedia daily pageviews are available online, so we can use this data to spot anomalies. Let’s see if there are any strange pageview patterns for Marie Curie.
Read More
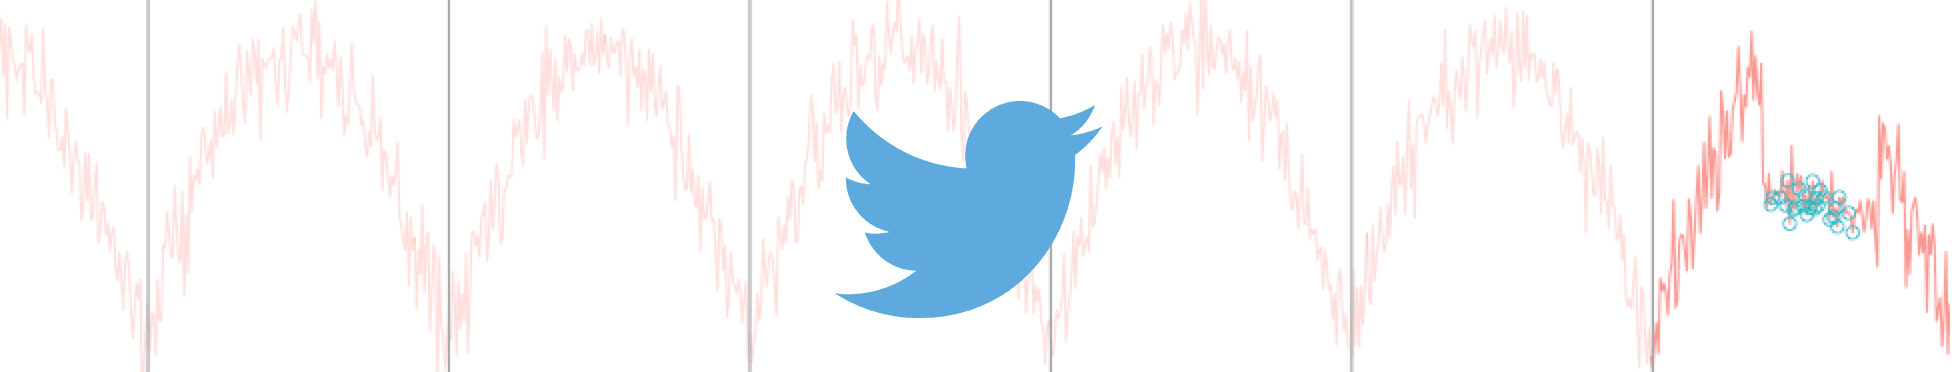
Twitter has made an open source anomaly detection package in R. Its goal is to detect anomalies in seasonal time series, as well as underlying trends. Read More
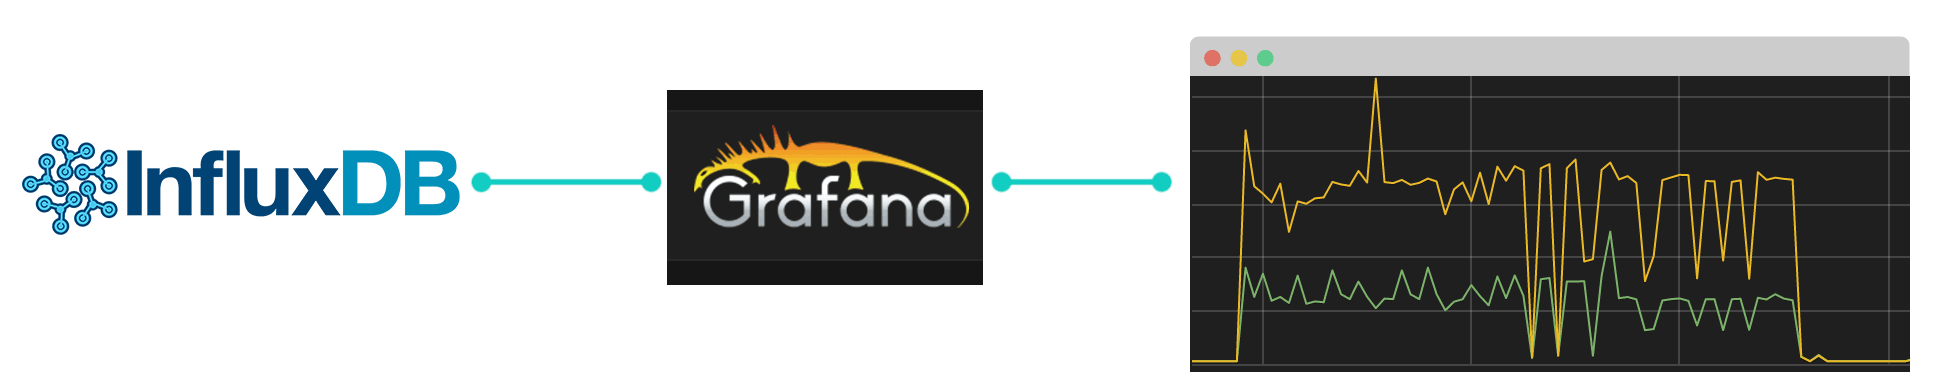
InfluxDB is often used with Grafana for dashboard monitoring. Grafana is a powerful metrics dashboard and graph editor. When Grafana is used with InfluxDB you can watch your metrics in real time. Read More

With the right configuration, CollectdD can save its metrics into InfluxDB, which can then be used as a data source for monitoring visualization. Read More

When you install CollectD, its default configuration already allows it to collect a lot of metrics from your system.
Today we will review this default configuration and change it to collect even more. Read More

© 2019 Anomaly.
 sending...