Install Graphite
on centOS
Graphite is a very powerful set of tools for monitoring and graphing server performance created in 2006. Graphite is still wildly used, but it’s now falling behind more modern monitoring solutions such as the trendy solution InfluxDB / Graphana.
Graphite Architecture
Graphite is a set of monitoring tools composed of:
- carbon – A (few) daemons in charge of listening for data (TCP/UDP)
- whisper – A database library for storing time series data
- graphite webapp – A Django webapp that renders graphs

CollectD can be used to record and push monitoring metrics into carbon-cache.
Install Graphite
Requirement
Open a terminal and install the required tools:
1 2 3 | sudo yum -y update sudo yum -y install httpd gcc gcc-c++ git pycairo mod_wsgi epel-release sudo yum -y install python-pip python-devel blas-devel lapack-devel libffi-devel |
Download and install Graphite
The following code snippet will download the last version of Graphite (carbon and web) and install writy my essay it all into /opt/graphite:
1 2 3 4 5 6 7 8 9 10 11 12 13 14 15 16 17 18 19 20 21 22 | cd /usr/local/src sudo git clone https://github.com/graphite-project/graphite-web.git sudo git clone https://github.com/graphite-project/carbon.git sudo pip install -r /usr/local/src/graphite-web/requirements.txt cd /usr/local/src/carbon/ sudo python setup.py install cd /usr/local/src/graphite-web/ sudo python setup.py install sudo cp /opt/graphite/conf/carbon.conf.example /opt/graphite/conf/carbon.conf sudo cp /opt/graphite/conf/storage-schemas.conf.example /opt/graphite/conf/storage-schemas.conf sudo cp /opt/graphite/conf/storage-aggregation.conf.example /opt/graphite/conf/storage-aggregation.conf sudo cp /opt/graphite/conf/relay-rules.conf.example /opt/graphite/conf/relay-rules.conf sudo cp /opt/graphite/webapp/graphite/local_settings.py.example /opt/graphite/webapp/graphite/local_settings.py sudo cp /opt/graphite/conf/graphite.wsgi.example /opt/graphite/conf/graphite.wsgi sudo cp /opt/graphite/examples/example-graphite-vhost.conf /etc/httpd/conf.d/graphite.conf sudo cp /usr/local/src/carbon/distro/redhat/init.d/carbon-* /etc/init.d/ sudo chmod +x /etc/init.d/carbon-* |
Configure Graphite
This code snippet creates the local database (SQLite). It also imports some static content for Graphite-webapp, and write my essay creates some folders with the correct permissions.
1 2 3 4 5 6 7 8 9 10 11 12 13 14 15 | cd /opt/graphite #create database sudo PYTHONPATH=/opt/graphite/webapp/ django-admin.py syncdb --settings=graphite.settings #reply: "Yes" and enter #user: root #passwd: myPassword #import static files sudo PYTHONPATH=/opt/graphite/webapp/ django-admin.py collectstatic --settings=graphite.settings # reply "yes" #set permission sudo chown -R apache:apache /opt/graphite/storage/ sudo chown -R apache:apache /opt/graphite/static/ sudo chown -R apache:apache /opt/graphite/webapp/ |
By default, the Apache package provided in CentOS is restrictive with regard to directory aliases. Edit graphite Apache conf to allow the static directory:
1 2 3 4 5 6 7 8 9 10 11 12 | sudo vim /etc/httpd/conf.d/graphite.conf [...] Alias /static/ /opt/graphite/static/ Require all granted Order allow,deny Allow from all Require all granted [...] |
Start Graphite
Carbon’s daemons can be started with systemd. Graphite-WebApp is an apache website. To start both simply run:
1 2 3 4 | sudo systemctl start carbon-cache sudo systemctl enable httpd sudo systemctl start httpd |
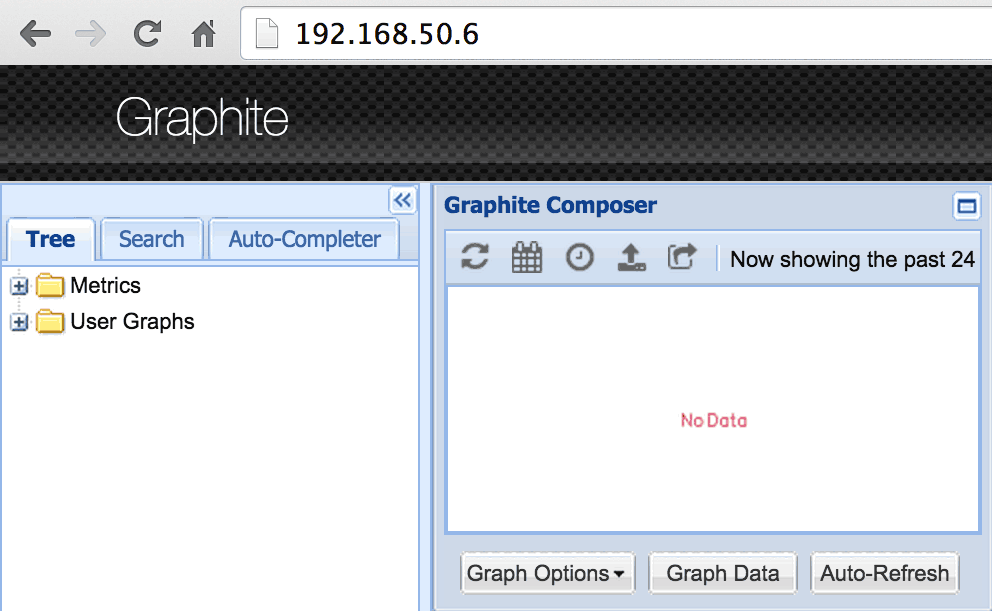
Access Graphite-WebApp
Open your browser at http://localhost/
Warning! To access a remote IP such as http://remote_ip/ you need to set rules in the CentOS default firewall, or simply disable it:
1 2 3 | #disable firewall sudo systemctl disable firewalld sudo systemctl stop firewalld |
No data should be available yet as we haven’t sent any metrics to Graphite.
Send Metrics to Graphite
Install CollectD
To collect and push metrics to Graphite, we like to use CollectD. To install CollectD, follow these easy instructions:
Configure CollectD
If you followed the instructions to install CollectD on CentOS, edit the configuration file located in /opt/collectd/etc/collectd.conf. Using the write_graphite plugin, forward CollectD metrics to Graphite on port 2003:
1 2 3 4 5 6 7 8 9 10 11 | sudo vim /opt/collectd/etc/collectd.conf # edit file [...] LoadPlugin write_graphite [...] Host "localhost" Port "2003" Prefix "collectd." Protocol "tcp" |
Start CollectD
If you installed the systemd script, simply run:
1 | sudo systemctl start collectd.service |
You can also start CollectD manually with:
1 | sudo /opt/collectd/sbin/collectd |
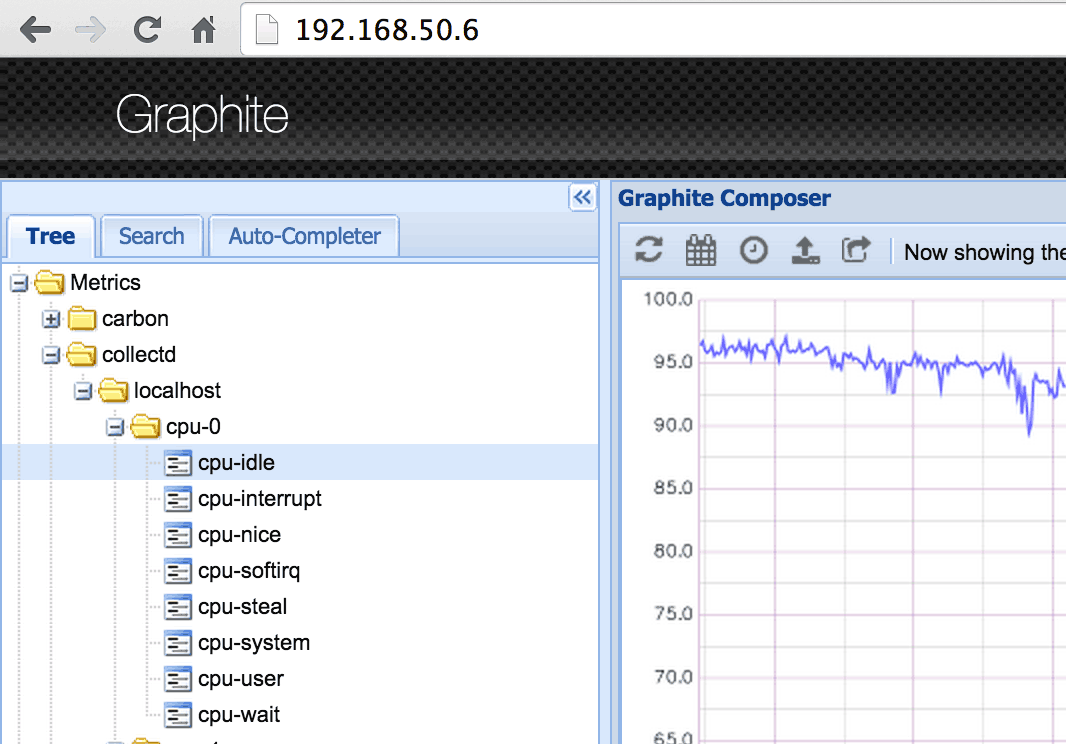
Wait a few seconds, then open Graphite-WebApp. You should see some new metrics in the left panel. Open one of them to render it.
Warming! by default Graphite-WebApp renders a 24 hour graph. To see some data points, zoom in or wait a bit longer.
Troubleshooting
If you follow the steps above exactly, everything should work just fine. If you don’t see any data in Graphite, try a few of these ideas.
Restart CollectD with Logging
Edit CollectD configuration and enable logging:
1 2 3 4 5 6 7 8 9 10 11 12 13 14 15 16 17 18 | sudo vim /opt/collectd/etc/collectd.conf # edit file [...] LoadPlugin syslog LoadPlugin logfile LogLevel info File STDOUT Timestamp true PrintSeverity false LogLevel info [...] #start CollectD in foreground /opt/collectd/sbin/collectd -f |
You shouldn’t see any messages like “write_graphite plugin: Connecting to localhost:2013 via tcp failed. The last error was: failed to connect to remote host: Connection refused”
Check Carbon-cache
Check the carbon-cache log:
1 | less +F /opt/graphite/storage/log/carbon-cache/carbon-cache-a/console.log |
Check Graphite-WebApp log
1 | less +F /opt/graphite/storage/log/webapp/error.log |
Check that All Processes are Running
Make sure every necessary process is running:
1 2 3 4 5 6 7 8 9 10 11 | ps aux | grep "carbon-ca\|httpd\|collectd\|(wsgi:graphite)" #result somthing like: # /usr/sbin/httpd -DFOREGROUND # (wsgi:graphite) -DFOREGROUND # [...] # sudo /opt/collectd/sbin/collectd -C /opt/collectd/etc/collectd.conf -f # /opt/collectd/sbin/collectd -C /opt/collectd/etc/collectd.conf -f # /usr/sbin/httpd -DFOREGROUND # [...] # /bin/python bin/carbon-cache.py --instance=a start |
Conclusion
Graphite is an incredible tool: easy to install, fast and flexible. Since its creation in 2006 it has seen the development of many plugins and tools. But it is getting a bit outdated by the next generation of monitoring tools, such as the trendy Grafana / Influx, which promise more flexibility and scalability.
The problem with graphite: it’s easy to monitor, but you need to spend your time watching all metrics to spot malfunctions. To solve this problem you could install Skyline to detect anomalies, but this will only detect (very) obvious problems. To monitor and detect complex anomalies in real time, sign up with Anomaly.io.
Monitor & detect anomalies with Anomaly.io
SIGN UP sending...