
With the right configuration, CollectdD can save its metrics into InfluxDB, which can then be used as a data source for monitoring visualization.
Requirements
First, uou need CollectD to be installed on your server. Here is how to install CollectD on Debian / Ubuntu and how to install CollectD on CentOS / Fedora.
You don’t need any special configuration of CollectD, as it monitors the basics by default. But if you want you can configure CollectD for more system monitoring.
Send Metrics from CollectD
By default Collectd configuration is located at /opt/collectd/etc/collectd.conf or /etc/collectd.conf
Edit this configuration file.
If the network plugin isn’t loaded already, add it:
1 | LoadPlugin network |
Also add the network plugin configuration:
1 2 | <Plugin "network"> Server "myinfluxdb.com" "25826" |
Localhost is the URL or IP address of your InfluxDB server, while 25826 is the port where InfluxDB will listen for CollectD metrics.
Receiving Metrics in InfluxDB
Upon InfluxDB startup, you should provide a config.toml file to overwrite default settings.
Start InfluxDB with your configuration or using this InfluxDB configuration example:
1 | influxd -config="config.toml" |
Edit config.toml and edit the [collectd] part; it should look like this:
1 2 3 4 5 | [collectd] enabled = true port = 25826 database = "collectd_db" typesdb = "/opt/collectd/share/collectd/types.db" |
- port = 25826; Make sure InfluxDB listens to the same port upon which CollectD is sending (see CollectD configuration above).
- database = “collectd_db”; InfluxDB will write CollectD metrics into the “collectd_db” database.
We will need to create this database in InfluxDB. - typesdb = “/opt/collectd/share/collectd/types.db”; this file defines how CollectD metrics are structured. It will help InfluxDB to save CollectD metrics correctly in the database.
Start CollectD and InfluxDB
Start InfluxDB with:
1 | influxd -config="config.toml" |
Start CollectD on Debian / Ubuntu or on CentOS / Fedora:
1 2 3 4 5 6 7 8 | #Debian/Ubuntu service collectd start #or CentOS/Fedora systemctl start collectd.service #or manualy /opt/collectd/sbin/collectd -C /opt/collectd/etc/collectd.conf -f |
With these settings, InfluxDB will write to a database called “collectd_db”.
Log in to the webadmin myinfluxdb.com:8083 (default credentials: root / root) to create the “collectd_db” database.
You can also create the database from the command line:
1 | curl -G http://myinfluxdb.com:8086/query --data-urlencode "q=CREATE DATABASE collectd_db" |
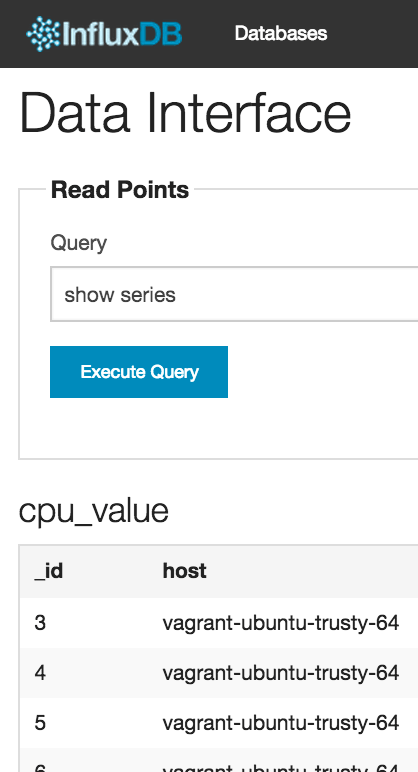
Now InfluxDB should receive and save CollectD metrics. Check this out from the command line:
1 | curl -G http://myinfluxdb:8086/query?pretty=true --data-urlencode "db=collectd_db" --data-urlencode "q=show series" |
or execute the command show series in the webadmin.
Live Dashboard
InfluxDB now records CollectdD metrics. The next step is to choose a dashboard to watch the metrics in real time.
We recommend using Grafana with InfluxDB
Monitor & detect anomalies with Anomaly.io
SIGN UP sending...