
Instinctively we look at anomalies by examining the number of events during a fixed period of time. However, this method can’t achieve fast detection rates, and fails to detect some anomalies. The Poisson distribution turns the problem upside-down by looking at the period of time for a fixed number of events.
Focus on Time Per Event
Traditional Anomaly Detection
A natural way of thinking about anomaly detection is to look at the number of events during a fixed period of time. After the aggregation process is finished, the accumulator reveals the final count of events during the fixed period. Comparing this number to our model (or prediction) will tell us if the value is anomalous.
Some examples of events per period of time:
- Number of pageviews per second on a website
- Number of sales per minute
- Number of doors opening per hour
The Problem
When it comes to anomaly detection, there are two major problems when using the “number of events per unit time” approach.
- The first problem is the aggregation process. Until the period ends, the count of events isn’t available, so anomaly detection can’t be performed. For some metrics, this period can be very long, and any anomalies will only be detected after this long delay. Small e-commerce websites usually monitor their sales per hour. In the worst case scenario, a breakdown in the payment system would be detected after a delay of two hours. This often just isn’t acceptable.
- The second problem is due to the normal fluctuations of counts. Due to randomness, a count might just happen to be lower than usual. Many other counts will be required to detect if this low value is indeed due to randomness or an actual anomaly. In fact, to detect small changes many periods needs to be accumulated. This might occur on an e-commerce website when only one payment method stops working. To detect the small change in sales, hours or even days will be required. This is almost never acceptable.
The Solution: Poisson Distribution
The Poisson distribution looks at the period of time for a fixed number of events. The Poisson distribution formula gives the event probabilities when the average rate is known.
Example 1: Poisson is Faster
Between 4 pm and 5 pm a website generates 70 pageviews per minute on average (λ = 70). What is the probability of having exactly 60 pages view in one minute (x = 60)? Using R and the Poisson distribution formula, the probability of exactly 60 pages view in one minute is 4.1%
1 | lamba |
What is the probability of exactly 0 pageviews (x = 0) in 15 seconds (λ = 70/4)?
1 | dpois(0, 70/4) #output 2.51e-08 |
There is only a 0.00000251% chance for this to occur. It can happen due to randomness, but because it’s so unlikely, we can consider it as unusual. An anomaly!
Probability of 45 or more pageviews (x >= 45) in 15 seconds (λ = 70/4):
1 | ppois(45, 70/4, lower.tail=F) #output 1.09e-08 |
ppois function sums the probability of 45, 46, 47 … ∞
Probability of 10 or more pageviews (x >= 10) in 1 second (λ = 70/60):
1 | ppois(10, 70/60, lower.tail=F) #output 4.7e-08 |
Those almost impossible probabilities define rules for anomaly detection:
- At least 1 event every 15 seconds
- No more than 45 events in 15 seconds
- No more than 10 events per second
Previously, the monitoring was made per minute. It would have required at least 1 minute before applying an anomaly detector. Now it can detect anomalies much faster, requiring 1 to 15 seconds. This is possible because for high rate λ the Poisson distribution follows the normal distribution.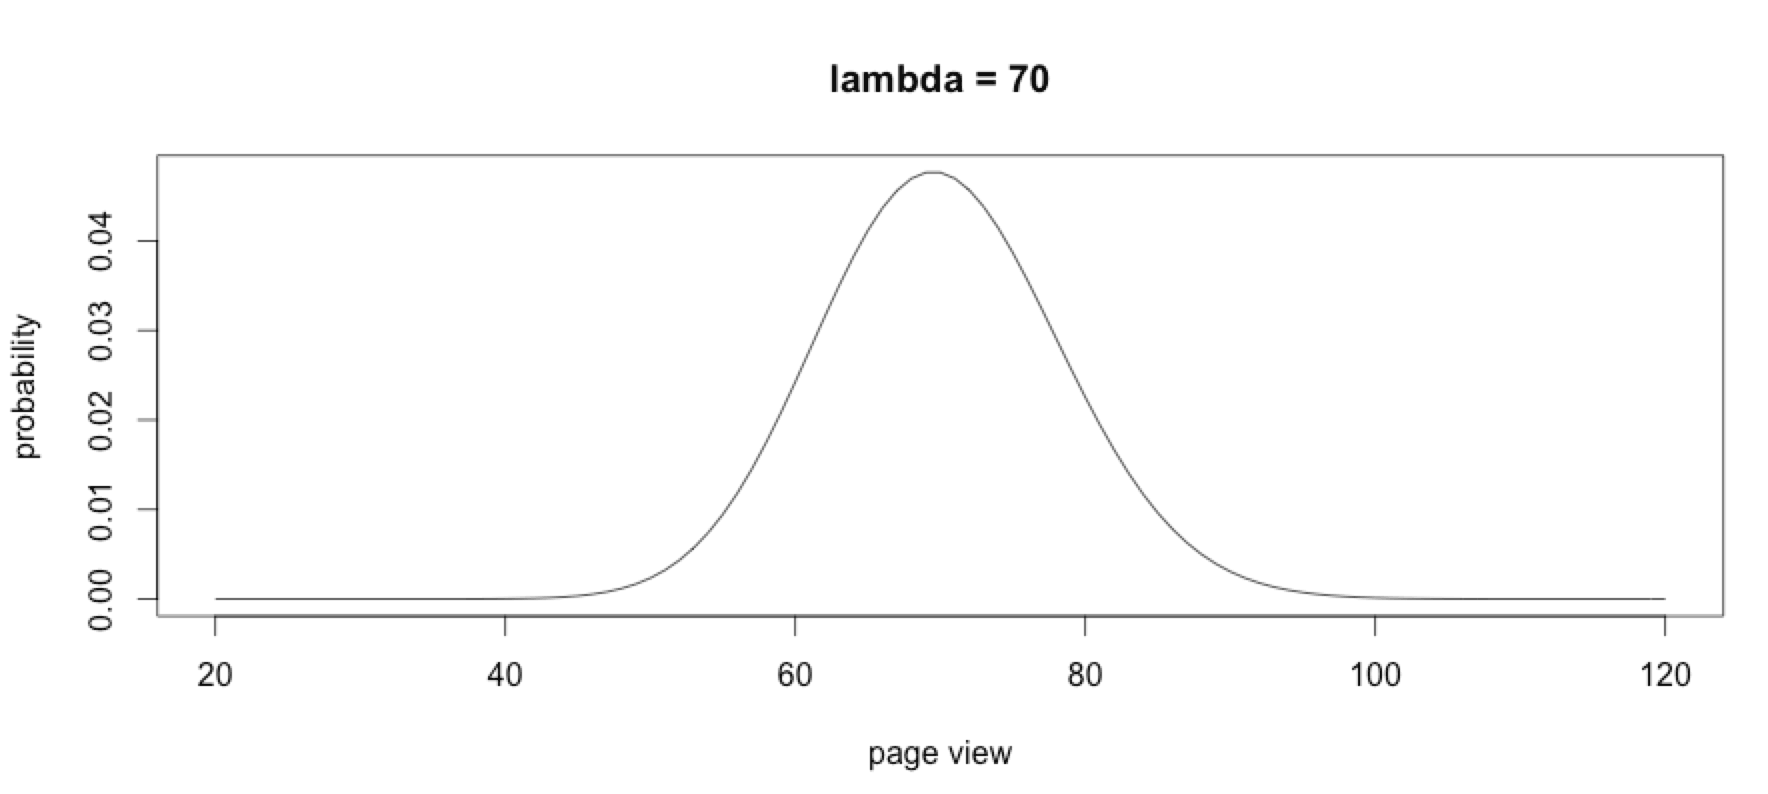
Example 2: Poisson is Sensitive to Small Changes
A small e-commerce website is selling 3 products per days (λ = 3). Doing the calculations, it will be unlikely to sell 0 products within 1.5 days.
1 | time |
Still, it is possible. Due to randomness, after 1 year (365 days * 0.011109 * 1.5) we might have detected 6 anomalies that aren’t real, which we also call “false positives.” But hey, this is our sales! It is worth the extra care of checking to make sure that the payment system is still working.
The Poisson distribution is sensitive to small changes. Under low rates, it would have been hard to detect an anomaly using the normal distribution without accumulating many days of sales records. This is because for low rate λ the Poisson distribution doesn’t follow the normal distribution.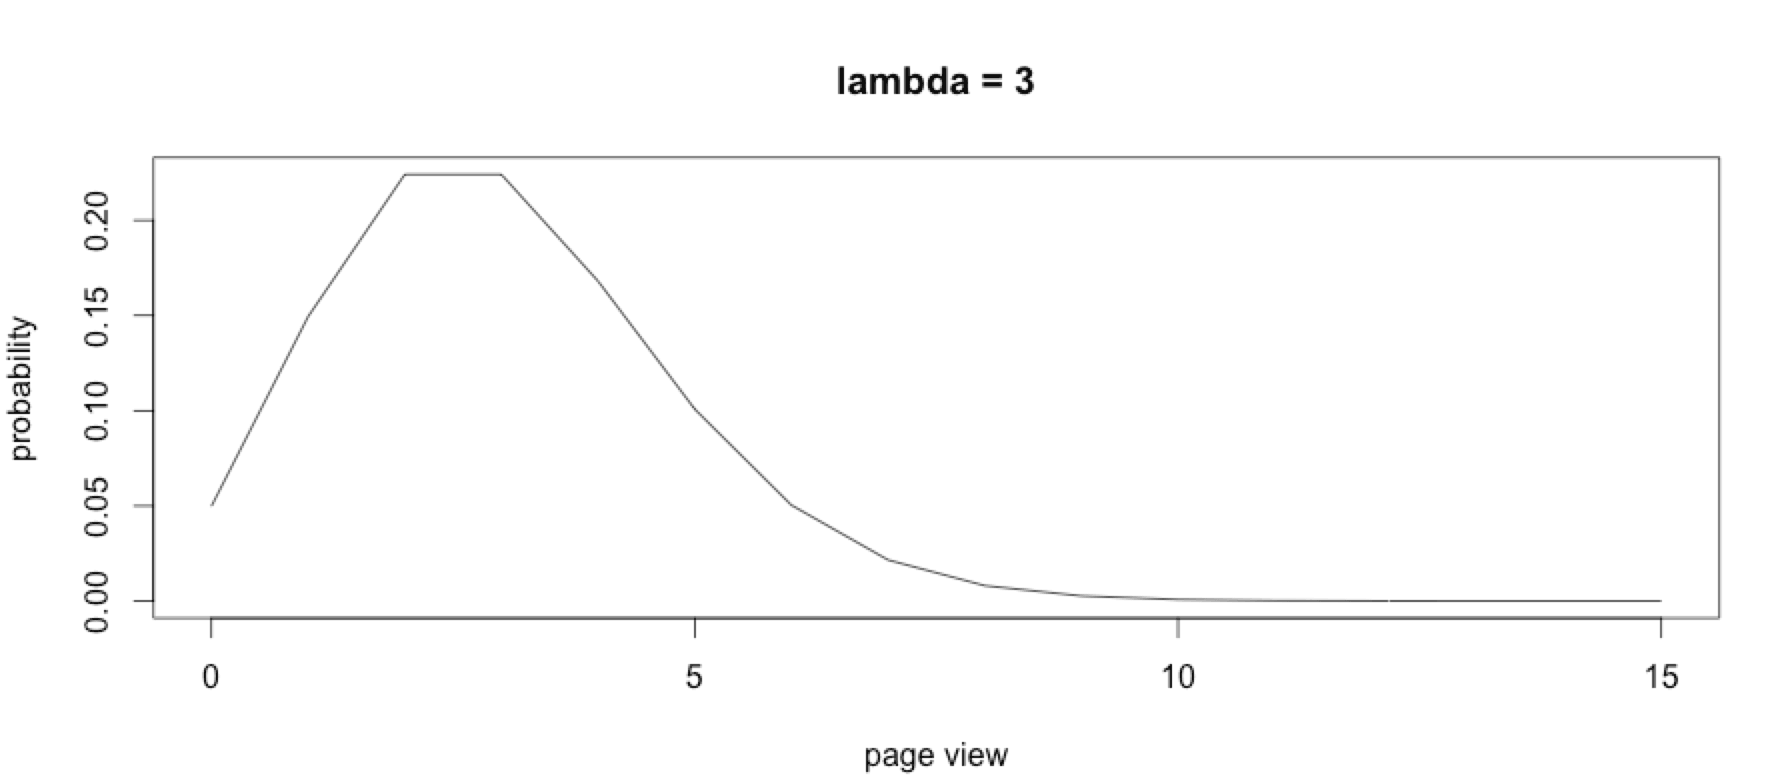
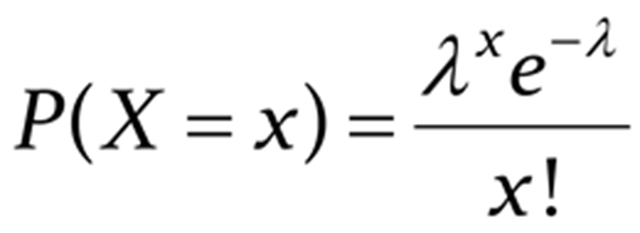
- x: exact number of successes
- e: Constant equal to approximately 2.71828
- λ: mean of successes in the given time interval
Implementation
In a previous example, we studied the Poisson distribution of a web server providing 70 pageviews per minute. Every 100 ms we check our 3 established rules for the anomaly detection:
- At least 1 event occurs every 15 seconds
- No more than 10 events occur in 1 second
- No more than 45 events occur in 15 seconds
Here is a simple prototype written in JavaScript:
1 2 3 4 5 6 7 8 9 10 11 12 13 14 15 16 17 18 19 20 21 22 23 24 25 26 27 28 29 30 31 32 33 34 35 36 37 38 39 40 41 42 43 44 45 46 47 48 49 50 51 52 53 54 55 56 | function printMsg(msg){ console.log(msg); } function Bucket (type) { this.time = new Date(); this.count = 0; this.newEvent = function(){ this.count++; this.check(); } this.check = function(){ var delta = new Date() - this.time; if(delta >= 15000 && this.count == 0){ printMsg("[ANOMALY] too slow"+this.count); }else if(delta <= 1000 && this.count >= 10){ printMsg("[ANOMALY] too fast (>10) => "+this.count); }else if(delta >= 15000 && this.count >= 45){ printMsg("[ANOMALY] too fast (>45) => "+this.count); } } } function AnomalyDetection(type) { this.buckets = new Array(); this.init = function(){ var self = this; setInterval(function(){ self.check() }, 100); } this.check = function(){ this.buckets.forEach(function(bucket) { bucket.check(); }); } this.event = function() { this.buckets.forEach(function(bucket) { bucket.newEvent(); }); var self = this; var newBucket = new Bucket(); setTimeout(function() { self.removeBucket(newBucket) }, 15000); this.buckets.push(newBucket); } this.removeBucket = function(bucket){ bucket.check(bucket); this.buckets.splice(this.buckets.indexOf(bucket),1); } } |
Using the anomaly detection:
1 2 3 4 5 6 7 8 | var detection = new AnomalyDetection(); detection.init(); var countEvent = 0; setInterval(function(){ detection.event(); printMsg("send event: "+countEvent++); }, 1166); |
This is just a proof of concept, and many optimizations are needed and additional work remains to be done. For example, it should include many more rules in the model. This implementation is too permissive, so some anomalies will not be detected.
Warning !
Usually λ Changes Over Time
Server monitoring usually exhibits some seasonal patterns. Very often the average rate λ isn’t the same during day and night, and it is also often different between weeks and weekends. In this kind of seasonality, λ can be chosen with a time shift of one week. The rate λ at “day 1 hour 1″ might be the same at “day 7 hour 1″. Shifting by one week might also capture the natural growth of the metric, as well as the annual pattern.
Finding λ isn’t always as easy as shifting by one week. In extreme seasonality, machine learning can be trained to follow complex patterns.
Check the Poisson distribution
The Poisson distribution is reliable under low event rates and fast to detect anomalies. However, it is important to make sure the metrics follow the Poisson distribution.
To have a Poisson distribution:
- Events need to occur independently
- The probability that an event occurs in a given length of time cannot change over time. (fixed λ)
In server monitoring, this isn’t always the case, due to the underlying nature of computer programs. For example, if one process locks a database record, any other accesses to that record must wait in a queue. This makes these events dependent, and so these events don’t follow the Poisson distribution.
Count Events, Not Values
A very common mistake is to use values as events to fit the Poisson distribution. For example, while it is possible to apply the Poisson distribution to the number of sales, you cannot use it for the value of sales.
Monitor & detect anomalies with Anomaly.io
SIGN UP sending...