Our brains are really fast at recognizing patterns and forms: we can often find the seasonality of a signal in under a second. It is also possible do this with mathematics using the Fourier transform.
First, we will explain what a Fourier transform is. Next, we will find the seasonality of a website from its Google Analytics pageview report using the R language.
Fourier Transforms Explained
The Fourier transform decomposes a signal into all the possible frequencies that comprise it. Fine, but how does it really work? (And keep it simple, please?)
1 – Pick a Frequency
First, the Fourier transform starts with the smallest frequency as possible. For a signal made of 100 points, the smallest frequency possible is 1/100 = 0.01 Hz. Think of a circle turning at a speed of 0.01 Hz, or 0.01 second if the points are recorded every second. Just like a clock.
1 circle turn = 0.01 s
2 – “Draw” the Signal Value on the Circle
Using the previously selected frequency we “draw” (decompose) the entire signal on the circle.
1 circle turn = 0.01 s
Notice: When the signal measurement is high, the clock arm of the circle is high.
The above signal will draw something like this:

Signal decomposition at 0.01 Hz
3 – Compute the Periodogram
All the measurements are now on the circle in two dimensions. We call these “vectors”. Summing the vectors together give the final “power” of the frequency. This occurs when all the vectors line up and point in the same direction, creating high values that represent the “power” of the frequency.
4 – Repeat with Different Frequencies
To complete the Fourier transform we repeat the process with different frequencies: 0.02 Hz, 0.03 Hz … We continue until all the “power” of each possible frequency has been computed. The frequencies with the highest power represent the greatest periodicity!
Detecting Seasonality (Example)
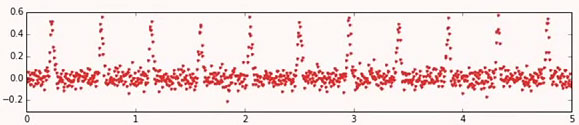
We just saw that the frequency with the highest “power” represents the primary seasonality of our underlying metric. In this example, William Cox draws at high speed the signal value on the circle for many different frequencies.
Here is how the original signal value appears:
To learn more, I recommend litening to William Cox talk about Fourier transforms:
In this example, a frequency of 2.1 gets a very high “power” value. This is where all the data line up and create a big vector.
From the frequency formula:
T = 1 / f
T = 1 / 2.1 Hz = 476 ms
The signal repeats every 476 ms. This is its seasonality!
Detecting Seasonality using R
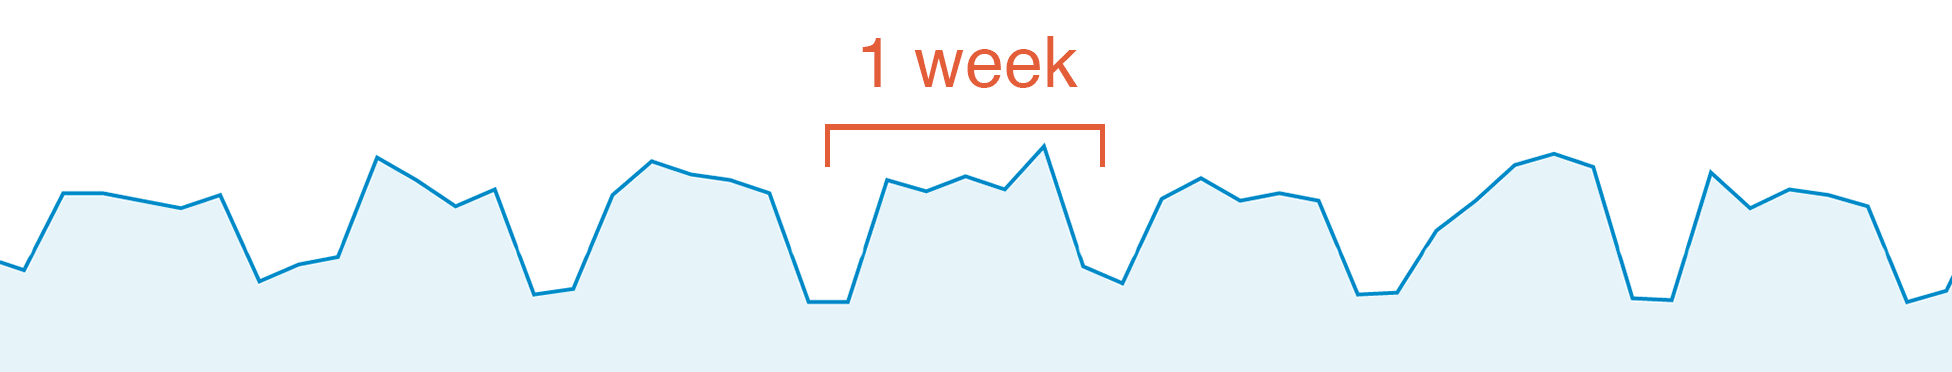
My personal tech blog clearly shows some weekly trends: It receives much less traffic during the weekend. As a result, my Google Analytics report shows some sort of weekly periodicity. Let’s try to find the seasonality using the R language.
1 2 3 4 5 6 7 8 9 | # Install and import TSA package install.packages("TSA") library(TSA) # read the Google Analaytics PageView report raw = read.csv("20131120-20151110-google-analytics.csv") # compute the Fourier Transform p = periodogram(raw$Visite) |
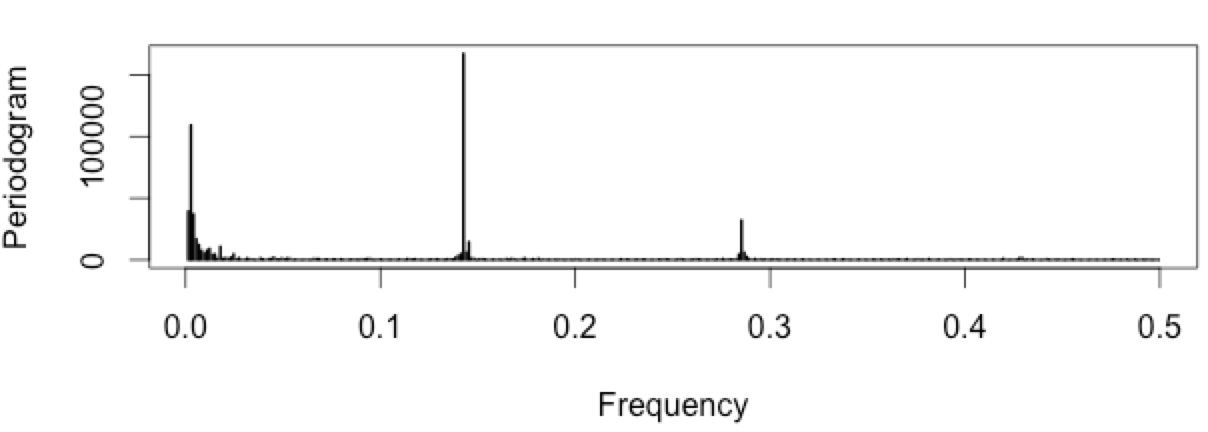
The periodogram shows the “power” of each possible frequency, and we can clearly see spikes at around frequency 0.15 Hz
1 2 3 4 5 6 | dd = data.frame(freq=p$freq, spec=p$spec) order = dd[order(-dd$spec),] top2 = head(order, 2) # display the 2 highest "power" frequencies top2 |
| freq | spec |
| 0.142661180 | 167143.1 |
| 0.002743484 | 109146.8 |
Frequencies of 0.142661180 Hz and 0.002743484 Hz show seasonality!
1 2 3 | # convert frequency to time periods time = 1/top2$f time |
> time
[1] 7.009615 364.500000
The main seasonality detected is 7 days. A secondary seasonality of 364.4 days was also found. Exactly what we expected! My blog has weekly seasonality as well as annual seasonality.
Monitor & detect anomalies with Anomaly.io
SIGN UP sending...
Pingback: Extract Seasonal & Trend: using decomposition in R - Anomaly()