StatsD is a simple yet powerful aggregation tool that is usually a good fit for code monitoring. Node.js makes it fast, but since it’s single threaded, it’s a bit challenging to scale up.
Why Scale StatsD?
On commodity hardware, StatsD can easily achieve rates of 40,000 messages per second. That’s a lot, but in some cases might not essay editing service be enough. Perhaps you are monitoring 100 metrics per pageview (and why not?). If so, above 400 pageviews per second StatsD will drop metrics.
In this article we will discuss three ways of scaling up StatsD:
Requirements
Install node.js
On Debian / Ubuntu:
1 2 | curl -sL https://deb.nodesource.com/setup_0.12 | sudo bash - apt-get install -y nodejs |
On CentOS / Fedora:
1 2 | curl -sL https://rpm.nodesource.com/setup | bash - yum install -y nodejs |
On Mac OS X with brew:
1 | brew install nodejs |
Download node.js install for Windows and MacOSX
I – StatsD Cluster Proxy
* didn’t really work out
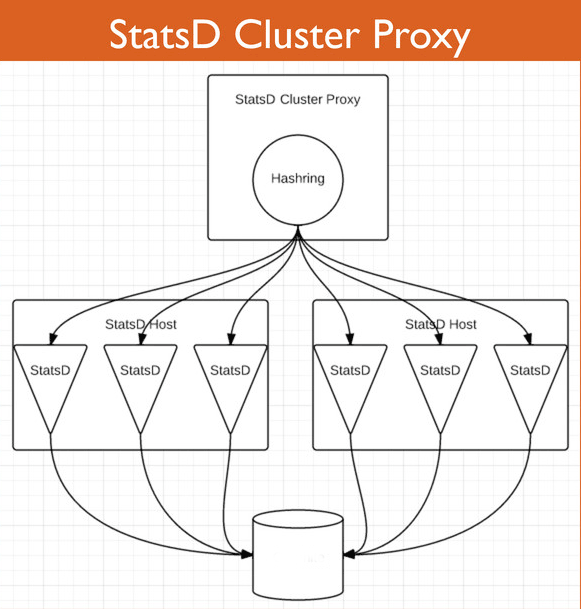
StatsD Cluster Proxy redirects load in front of other StatsD workers. It always routes the same metric types to the same StatsD process, using a hashring.
If an instance goes down, the hashring is paper writers recalculated so (almost) no metrics get lost.
The main problem: it’s still single threaded. It becomes the new bottleneck and achieved fewer messages per second than a single StatsD, at least in the current version.
First, install and configure StatsD
Then create a proxyConf.js file:
1 2 3 4 5 6 7 8 9 10 11 12 13 14 | { nodes: [ {host: '127.0.0.1', port: 8010, adminport: 8011}, {host: '127.0.0.1', port: 8020, adminport: 8021}, {host: '127.0.0.1', port: 8030, adminport: 8031}, {host: '127.0.0.1', port: 8040, adminport: 8041} ], udp_version: 'udp4', host: '0.0.0.0', port: 8000, forkCount: 0, checkInterval: 1000, cacheSize: 10000 } |

Create four StatsD configuration files:
File node1.js :
1 2 3 4 5 6 | { port: 8010, mgmt_port: 8011, backends: [ "./backends/console" ], deleteIdleStats: true } |
File node1.js :
1 2 3 4 5 6 | { port: 8010, mgmt_port: 8011, backends: [ "./backends/console" ], deleteIdleStats: true } |
File node2.js :
1 2 3 4 5 6 | { port: 8020, mgmt_port: 8021, backends: [ "./backends/console" ], deleteIdleStats: true } |
File node4.js :
1 2 3 4 5 6 | { port: 8040, mgmt_port: 8041, backends: [ "./backends/console" ], deleteIdleStats: true } |
Run StatsD Proxy Cluster:
1 2 3 | $ $ node proxy.js proxyConfig.js $ |
Run the 4 StatsD processes:
1 2 3 4 | node stats.js node1.js node stats.js node2.js node stats.js node3.js node stats.js node4.js |
Results:
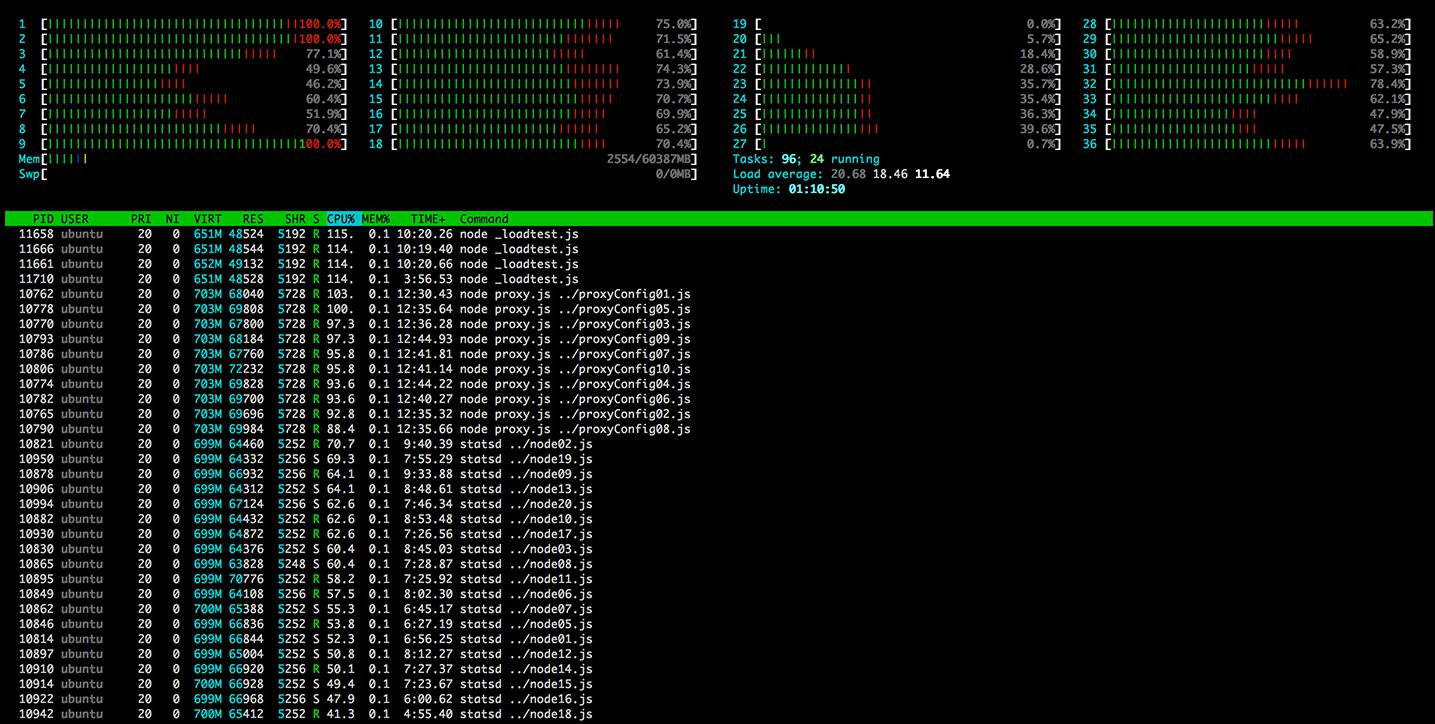
Doing some load testing yielded disappointing results. StatsD Proxy Cluster is single threaded, so it becomes the new bottleneck. I was able to achieve “only” 30k events per second.
The proxy cluster reaches 100% CPU and starts dropping events. Behind the proxy, the workers didn’t do much.

StatsD Proxy Cluster isn’t ready yet for scaling up by itself. Still, it’s a good tool that adds a lot of flexibility.
II – Hashring in Code
StatsD Cluster Proxy uses the clever idea of the Hashring. As this process is the bottleneck, why not moving the logic into our own code?
Almost all programming languages have a hashring library. If you’re developing in node.js you can use node-hashring
1 2 3 4 5 6 7 8 9 10 11 | var HashRing = require('hashring'); var ring = new HashRing({ '127.0.0.1:8010', '127.0.0.1:8020', '127.0.0.1:8030', '127.0.0.1:8040' }); var server = ring.get('my.own.metric.name'); console.log("this metrics should be sent to "+server) |
The hashring tell us where the metrics “my.own.metric.name” should be sent:
> this metric should be sent to 127.0.0.1:8040
Fully working Hashring code:
1 2 3 4 5 6 7 8 9 10 11 12 13 14 15 16 17 18 19 20 | var lynx = require('lynx'); var HashRing = require('hashring'); var ring = new HashRing(['127.0.0.1:8010', '127.0.0.1:8020', '127.0.0.1:8030', '127.0.0.1:8040']); var kv = { '127.0.0.1:8010': new lynx('127.0.0.1', 8010), '127.0.0.1:8020': new lynx('127.0.0.1', 8020), '127.0.0.1:8030': new lynx('127.0.0.1', 8030), '127.0.0.1:8040': new lynx('127.0.0.1', 8040) } function sendMetrics(){ for(var i = 0; i != 200; i++) { var name = "my.metrics.counter_"+i; var clientName = ring.get(name); var client = kv[clientName]; client.increment(name); } } setInterval(sendMetrics, 0) |
You will have to create the four StatsD configuration files and start the four processes.
(see explanation in Part I above)
III – One StatsD Proxy Per Host
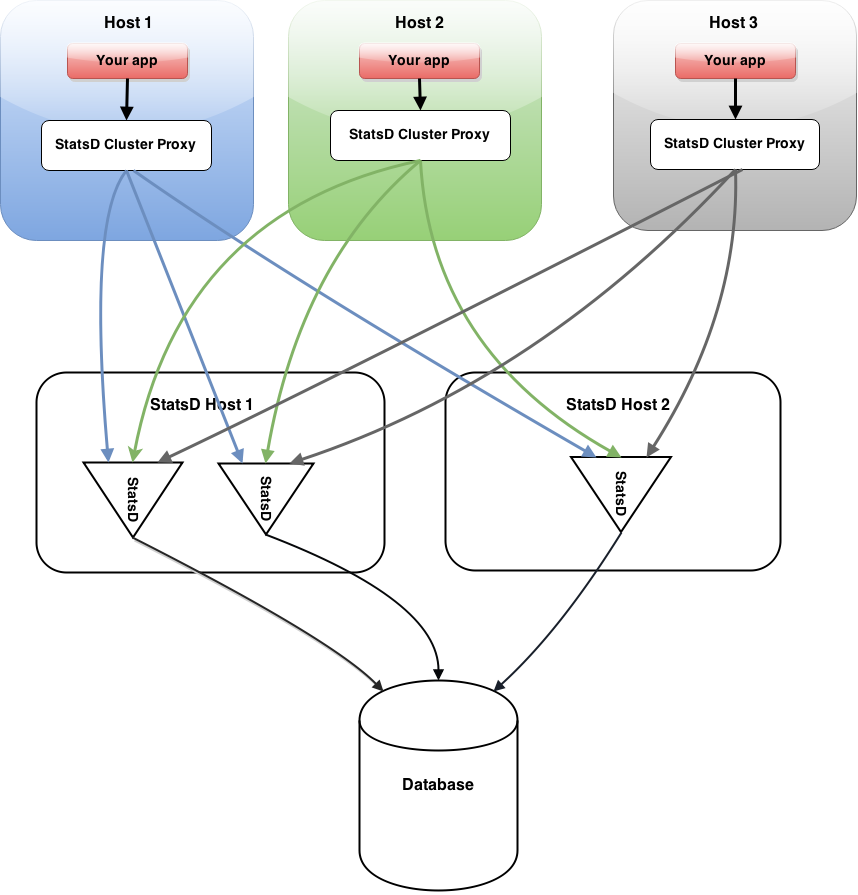
If you need to scale StatsD, chances are that you are running a cluster. In a clustered environment, multiple servers run in parallel, so you can install one proxy cluster per host. Calling the proxy on localhost will redirect the same events to the same StatsD process.
Rule of thumbs under heavy load: number of StatsD processes = number of StatsD proxies
Monitor & detect anomalies with Anomaly.io
SIGN UP


 sending...