
Skyline is free and open source anomaly detection software. Simply plug Graphite metrics into Skyline to detect anomalous behaviour automatically without any configuration.
Skyline Architecture
Skyline is usually set to use Graphite metrics. This is done by placing a daemon call “carbon-relay” in front of the usual Graphite stack. Carbon-relay will repeat the metrics to multiple hosts. One of them will be the essay editing service traditional Graphite stack, and the other host will be the Skyline stack.
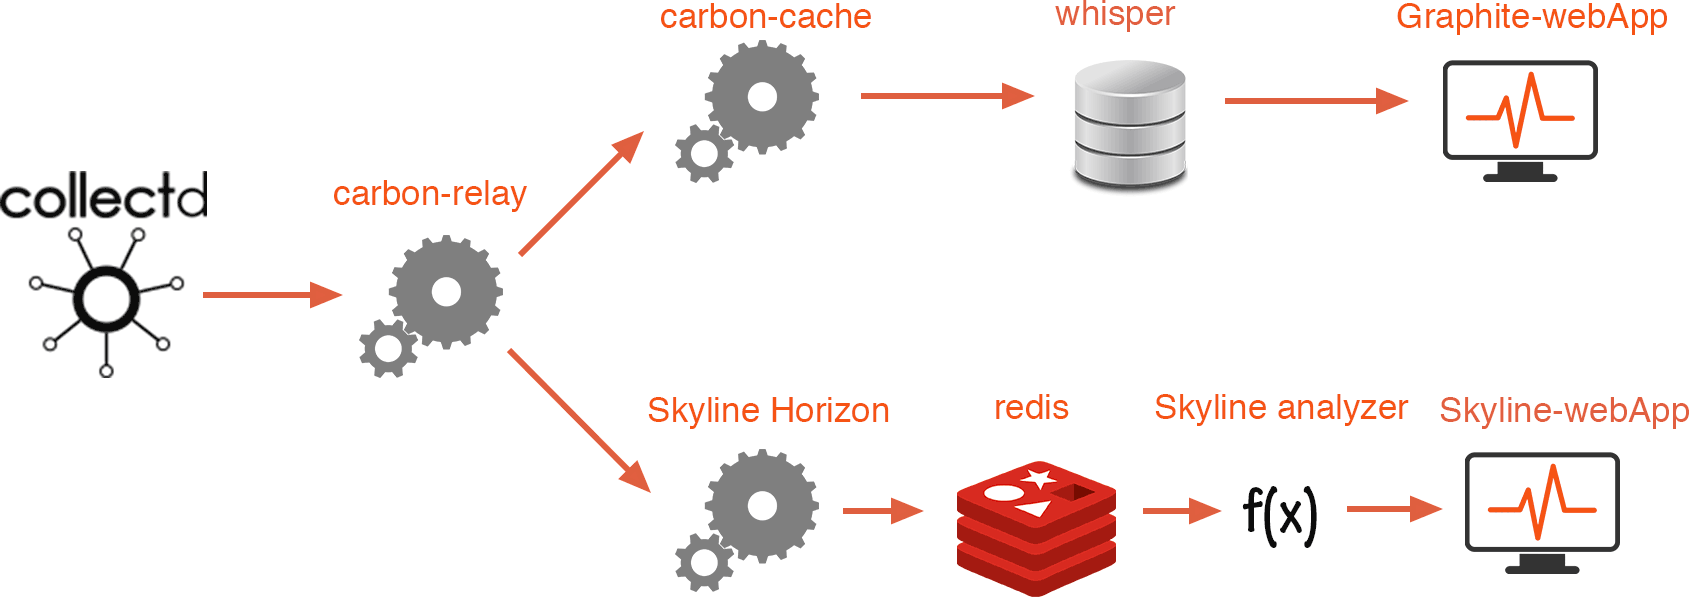
Skyline is composed of several parts:
- Horizon – Responsible for collecting, cleaning, and formatting incoming metrics before pushing to a Redis database.
- Analyzer – Fetches metrics from Redis and runs mathematical equations to detect anomalies
- Skyline-webapp – A Django webapp to display an anomaly graph when it occurs
In the above schema, CollectD is used to monitor and push server metrics to carbon-cache. Read more about Graphite architecture.
Install Graphite
Graphite Required
Skyline is commonly used with Graphite. That’s why you need to Install Graphite on CentOS.
You don’t have to run the Graphite full stack; running carbon-relay is enough. But, as carbon-relay is part of Graphite, you still have to install Graphite.
Configure Carbon-relay
Set the list of hosts carbon-relay needs to forward its metrics to.
1 2 3 4 5 6 | sudo vim /opt/graphite/conf/relay-rules.conf # change the file [...] destinations = 127.0.0.1:2004, 127.0.0.1:2024 [...] |
With this configuration, carbon-relay will forward metrics to Skyline on port 2024 and to paper writers carbon-cache (Graphite) on port 2004. Both services run locally in this tutorial. Also, edit the carbon configuration:
1 2 3 4 5 6 | sudo vim /opt/graphite/conf/carbon.conf # change the file [...] DESTINATIONS = 127.0.0.1:2004, 127.0.0.1:2024 [...] |
Start carbon-relay
Start carbon-relay using systemd:
1 | sudo systemctl restart carbon-relay |
Install Skyline
Required
Open a terminal and install a few tools. This includes an Apache server (which is probably already installed), the Redis database, and Python with few mathematical libraries and some compile tools:
1 2 3 | sudo yum -y install httpd redis git sudo yum -y install gcc gcc-c++ git pycairo mod_wsgi sudo yum -y install python-pip python-devel blas-devel lapack-devel libffi-devel |
Download and install Skyline
1 2 3 4 5 6 7 8 9 10 11 12 | cd /opt sudo git clone https://github.com/etsy/skyline.git cd /opt/skyline sudo pip install -U six sudo pip install -r requirements.txt sudo pip install numpy sudo pip install scipy sudo pip install pandas sudo pip install patsy sudo pip install statsmodels sudo pip install msgpack-python |
Some of the Python packages might take very long to compile. Be patient, maybe grab a coffee…
Configure Skyline
Don’t forget to create the required directory and configuration:
1 2 3 4 5 | sudo cp /opt/skyline/src/settings.py.example /opt/skyline/src/settings.py sudo mkdir /var/log/skyline sudo mkdir /var/run/skyline sudo mkdir /var/log/redis sudo mkdir /var/dump/ |
Skyline requires some settings, so edit the file:
1 | sudo vim /opt/skyline/src/settings.py |
and replace the following with your own values:
- GRAPHITE_HOST = ‘YOUR_GRAPHITE_HOST‘
- HORIZON_IP = ‘0.0.0.0‘
- WEBAPP_IP = ‘YOUR_SKYLINE_HOST_IP‘
In my case I replace with the same IP as Skyline and Graphite run locally on the same host:
- GRAPHITE_HOST = ‘192.168.50.6‘
- HORIZON_IP = ‘0.0.0.0‘
- WEBAPP_IP = ‘192.168.50.6‘
Start Skyline
The Skyline stack is made up of a Redis database and three Python processes. Start all services:
1 2 3 4 5 6 | cd /opt/skyline/bin sudo redis-server redis.conf sudo ./horizon.d start sudo ./analyzer.d start sudo ./webapp.d start |
Access Skyline-WebApp
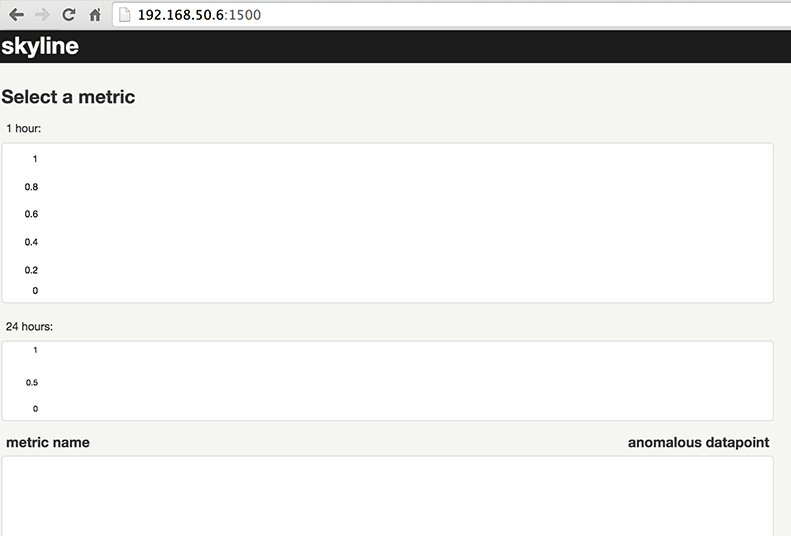
Open your browser at http://localhost:1500/
Warning! To access a remote IP such as http://remote_ip:1500/ you need to set rules into the CentOS default firewall. Or simply disable the firewall:
1 2 3 | #disable firewall sudo systemctl disable firewalld sudo systemctl stop firewalld |
Skyline-WebApp should be empty as no anomaly will have been detected at first. Don’t worry if some anomalies are listed. This will stabilize with time.
Send Metrics to Skyline and Graphite
Carbon-relay now forwards its data to Skyline and carbon-cache. Any metrics sent to carbon-relay should be available in Skyline and Graphite.
Install CollectD
To collect and push metrics to carbon-relay we like to use CollectD. If you haven’t installed CollectD yet, follow these easy instructions:
Configure CollectD
Carbon-cache listens on a different port. Make sure you edit /opt/collectd/etc/collectd.conf to send the data on port 2013.
1 2 3 4 5 6 7 8 9 10 11 | sudo vim /opt/collectd/etc/collectd.conf # edit the file [...] Host "localhost" Port "2013" Prefix "collectd." Protocol "tcp" [...] |
Start CollectD
If you installed the systemd script simply run:
1 2 3 4 5 | # start with SytemD sudo systemctl restart collectd.service # or manualy sudo /opt/collectd/sbin/collectd |
Test Skyline Integration
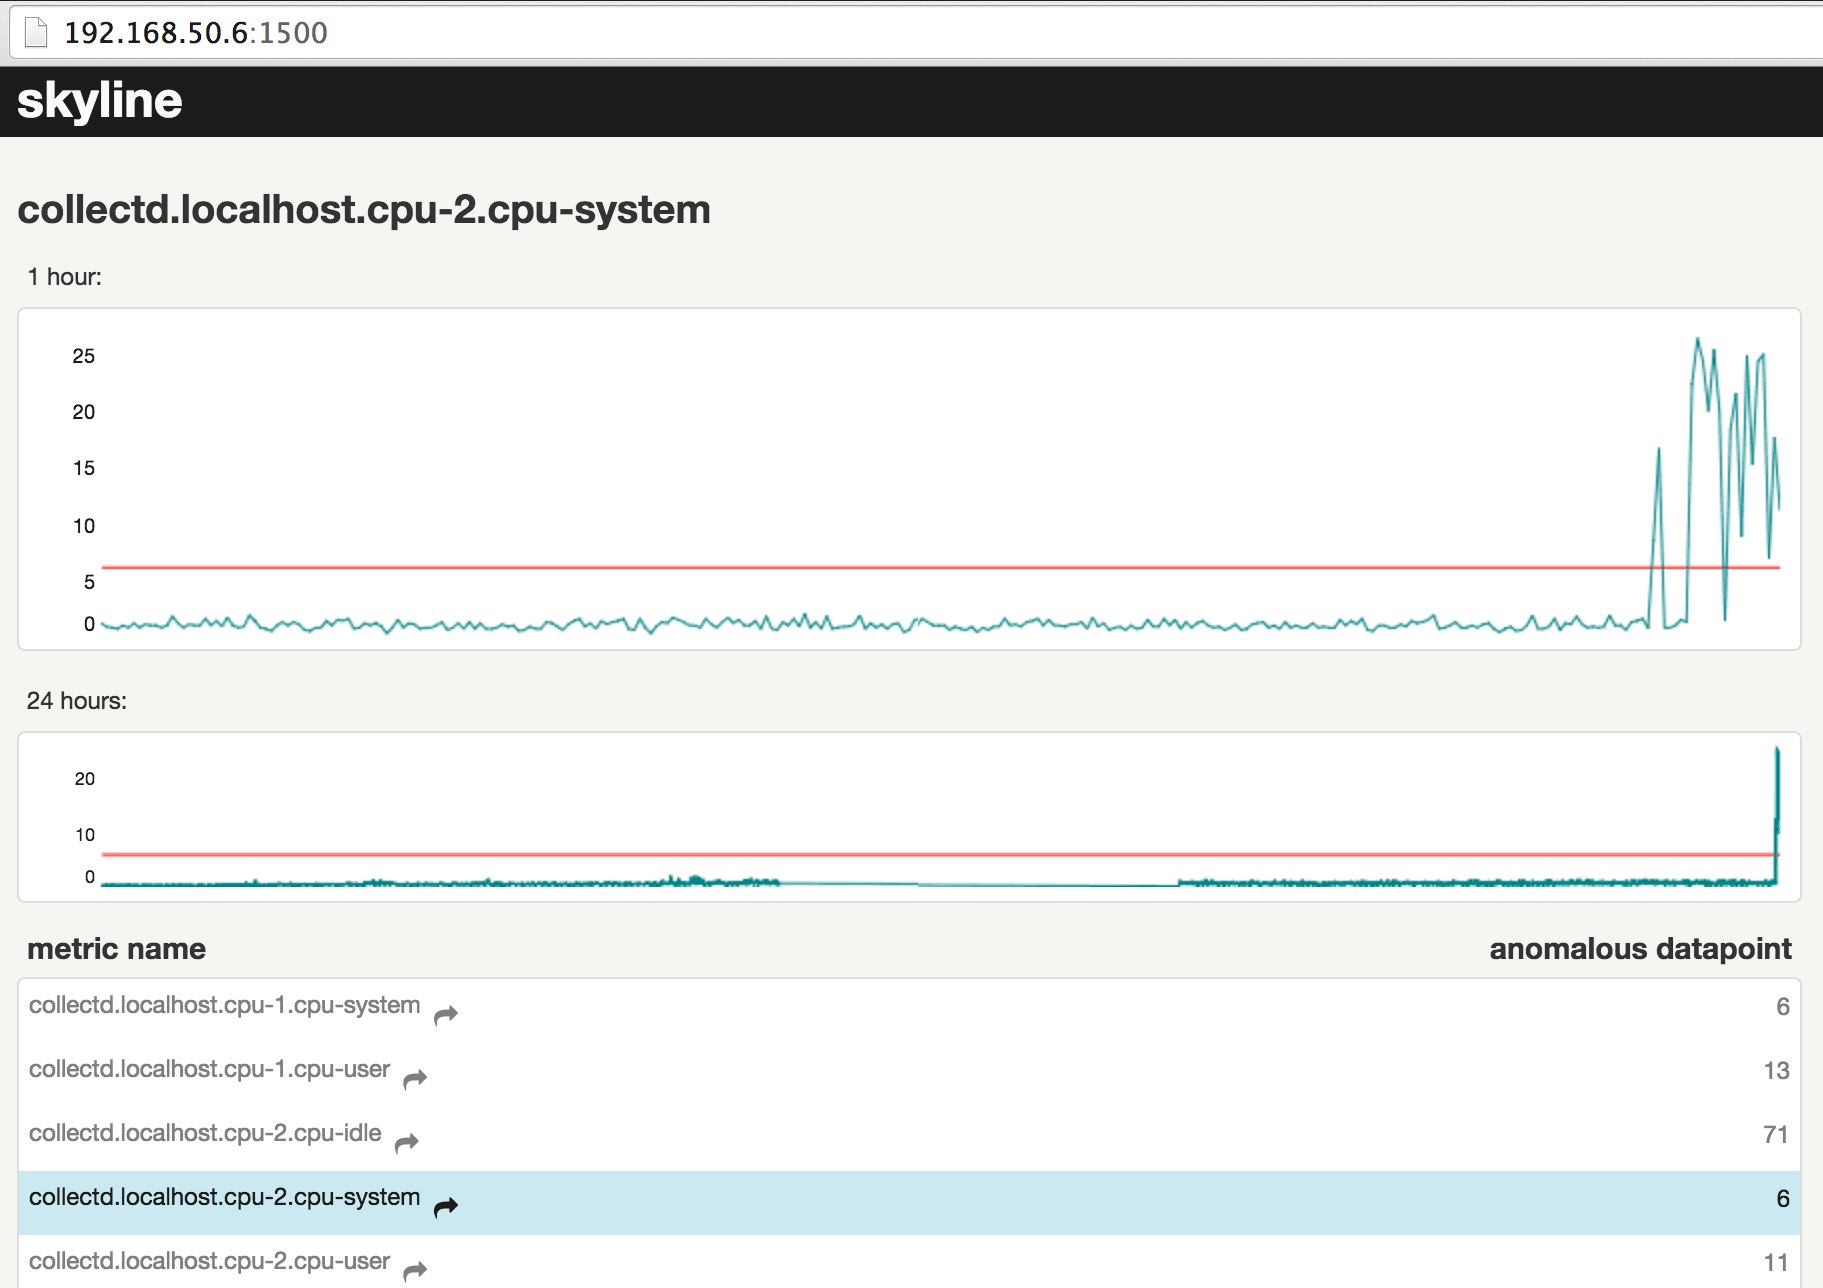
Let your Linux idle for at least 10 minutes. Skyline will train itself to recognize low CPU activity as being normal. To create an anomaly, suddenly create some high CPU activity:
1 2 3 4 5 | # wait at least 10 minutes before creating the anomaly timeout 40s dd if=/dev/zero of=/dev/null & timeout 40s dd if=/dev/zero of=/dev/null & timeout 40s dd if=/dev/zero of=/dev/null & timeout 40s dd if=/dev/zero of=/dev/null & |
Open Skyline-webApp in your browser on port 1500. It should detect the anomaly within 10 seconds.
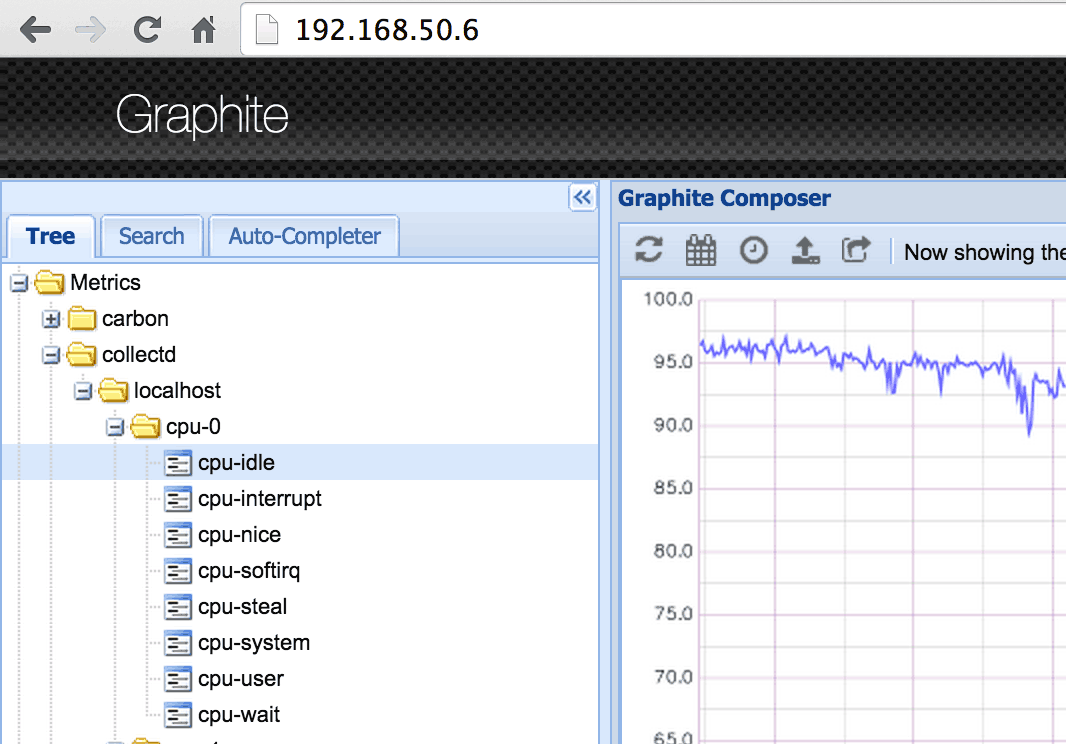
Test Graphite
Graphite should still work the same as before, since it receives its metrics through carbon-relay. Wait a few seconds and open Graphite-WebApp. Same as previously, you should see some new metrics in the left panel. Open one of them to render it.
Warming! By default, Graphite-WebApp renders a 24 hour graph. To see some data points zoom in or wait a bit longer.
Troubleshooting
If you follow the above steps exactly, this should work just fine. But in case you don’t see your data in Graphite try the following.
Check Graphite Troubleshooting
Try the troubleshooting solutions provided in Graphite installation tutorial.
Check Skyline log files
1 2 3 | less +F /var/log/skyline/horizon.log less +F /var/log/skyline/analyzer.log less +F /var/log/skyline/webapp.log |
Check That Every Process is Running
1 2 3 4 5 6 7 8 9 10 11 12 13 14 15 16 | ps aux | grep "carbon-ca\|httpd\|collectd\|(wsgi:graphite)\|horizon-agent.py\|analyzer-agent.py\|horizon-agent.py\|carbon-relay.py\|webapp.py" # result somthing like: # [...] # sudo /opt/collectd/sbin/collectd -C /opt/collectd/etc/collectd.conf -f # [...] # python /opt/skyline/bin/../src/horizon/horizon-agent.py start # [...] # python /opt/skyline/bin/../src/analyzer/analyzer-agent.py start # [...] # python /opt/skyline/bin/../src/webapp/webapp.py restart # /usr/sbin/httpd -DFOREGROUND # [...] # /bin/python bin/carbon-relay.py --instance=a start # /bin/python bin/carbon-cache.py --instance=a start # [...] |
Conclusion
Skyline is the first of its kind: it detects anomalies and trigger alarms in real time. Skyline is definitively trying to build a better world, where DevOps don’t need to spend their time watching metrics!
But there are some drawbacks. It only detects very obvious anomalies. This isn’t too bad, as many anomalies are obvious, but it will still fail to detect complex anomalies. the idea was to build a solution you can extend with homemade detectors, but no third party detectors have yet been released, so we are stuck with the basic functionality.
Of course I’m biased, but for easier monitoring and detection of many other anomaly types, I recommend using our product “Anomaly.io”. We believe it beats Skyline in every way.
Monitor & detect anomalies with Anomaly.io
SIGN UP sending...