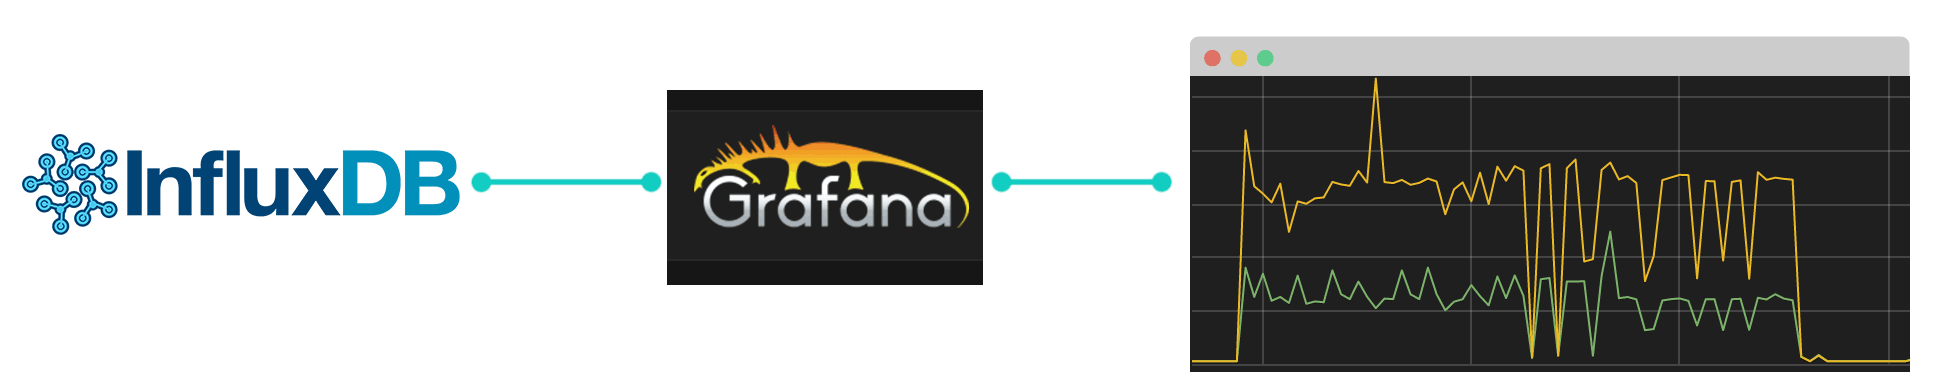
InfluxDB is often used with Grafana for dashboard monitoring. Grafana is a powerful metrics dashboard and graph editor. When Grafana is used with InfluxDB you can watch your metrics in real time.
Requirements
- InfluxDB must be up and running, with some metrics recorded
- (Optional) At least some CollectdD metrics have been sent to InfluxDB
Install and Start Grafana
On Debian / Ubuntu:
1 2 3 4 5 6 | cd /tmp/ wget https://grafanarel.s3.amazonaws.com/builds/grafana_2.0.2_amd64.deb apt-get install -y adduser libfontconfig dpkg -i grafana_2.0.2_amd64.deb systemctl start grafana-server #start grafana |
On CentOS / Fedora (RedHat):
1 2 3 | yum install https://grafanarel.s3.amazonaws.com/builds/grafana-2.0.0_beta3-1.x86_64.rpm systemctl start grafana-server #start grafana |
Grafana will start automatically at boot time:
- Environment variables are located in /etc/default/grafana-server
- Configuration file can be found in /etc/grafana/grafana.ini
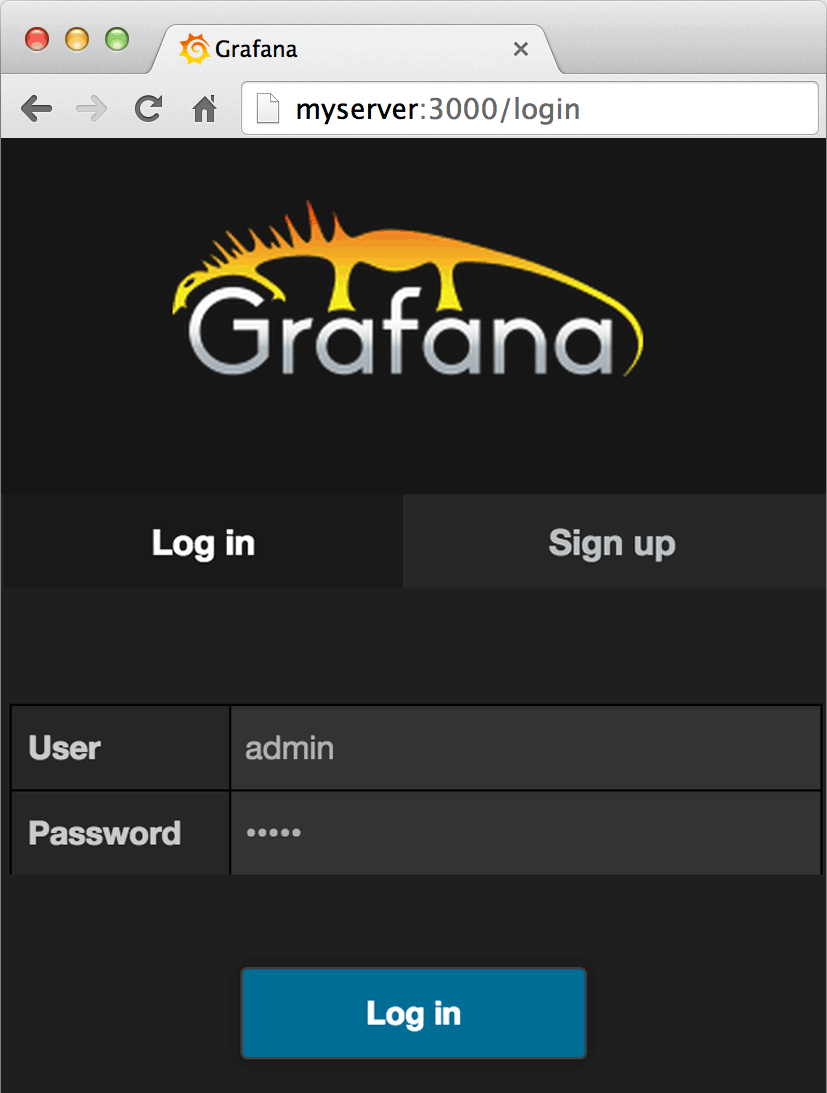
By default, Grafana UI will start on port 3000. Open a web browser to http://myserver.com:3000 (default password: admin / admin )
Setting InfluxDB as Grafana’s Data Source
Let’s set up Grafana and add InfluxDB as a data source for live monitoring. Since a picture is worth a thousand words, follow these graphical steps:
1- Click on the Menu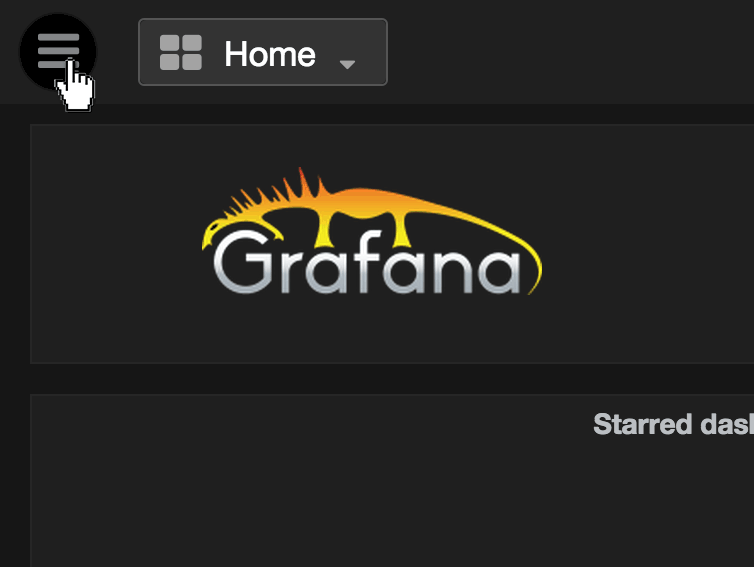
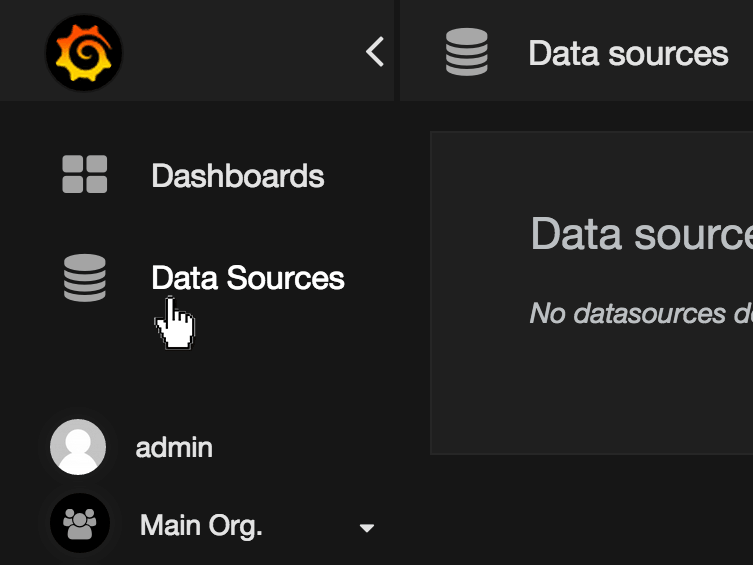
2- Select a New Data Source
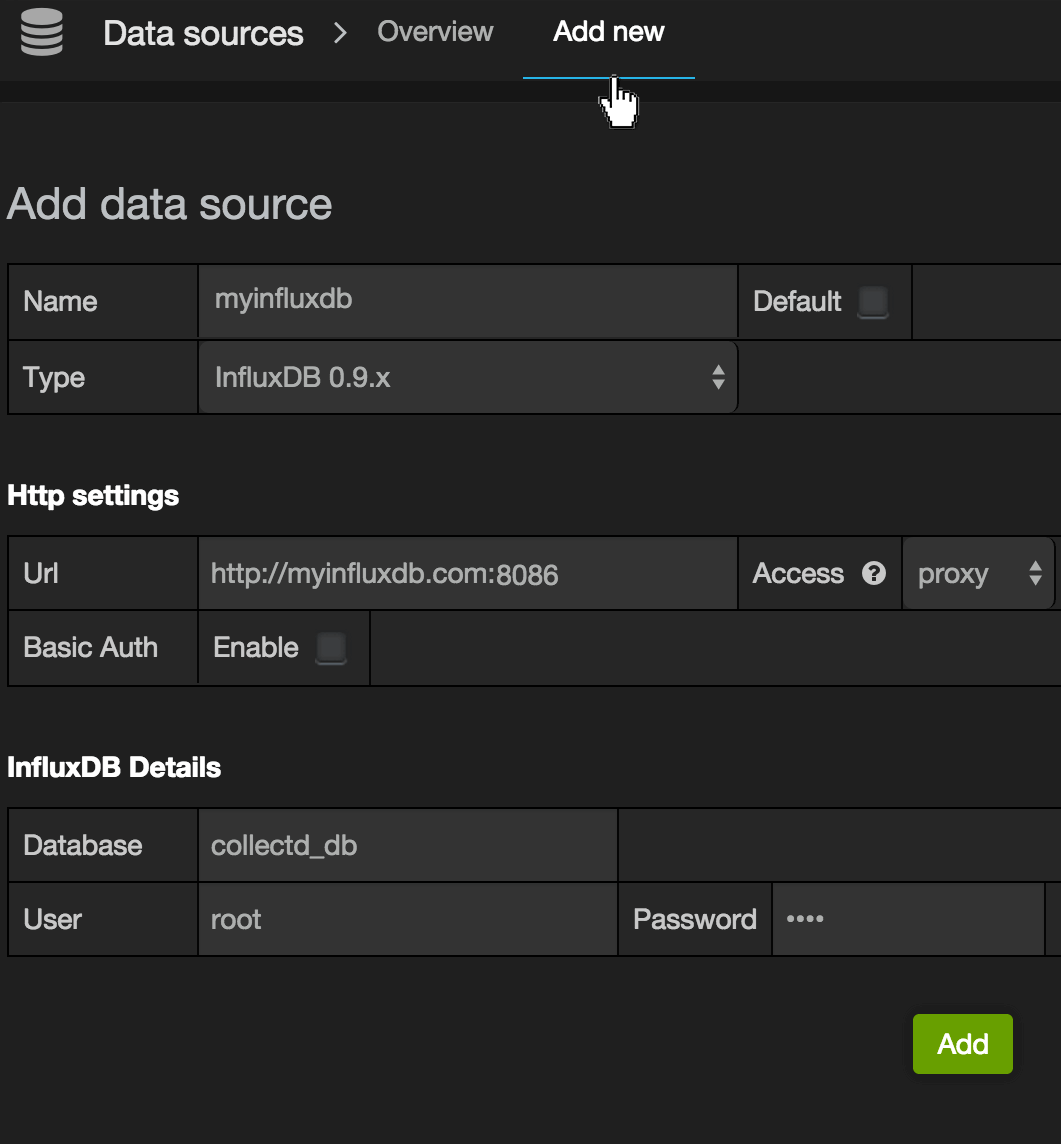
3- Add InfluxDB as Grafana Data Source
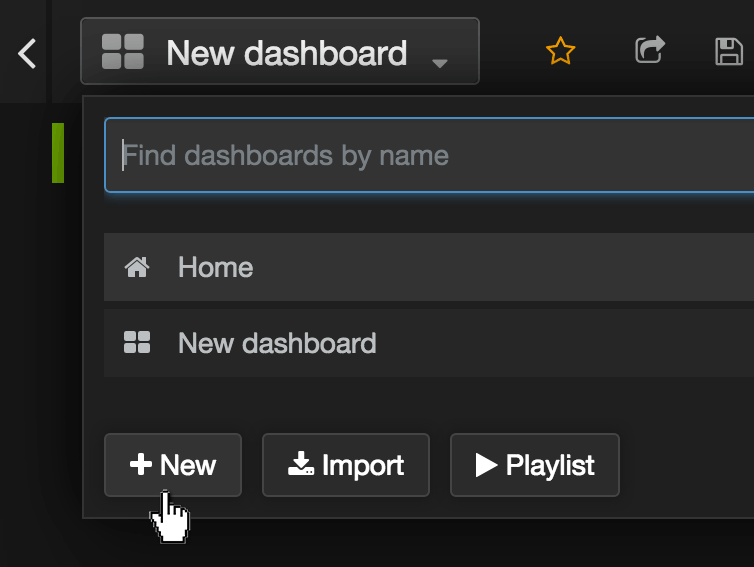
4- Create a New Dashboard
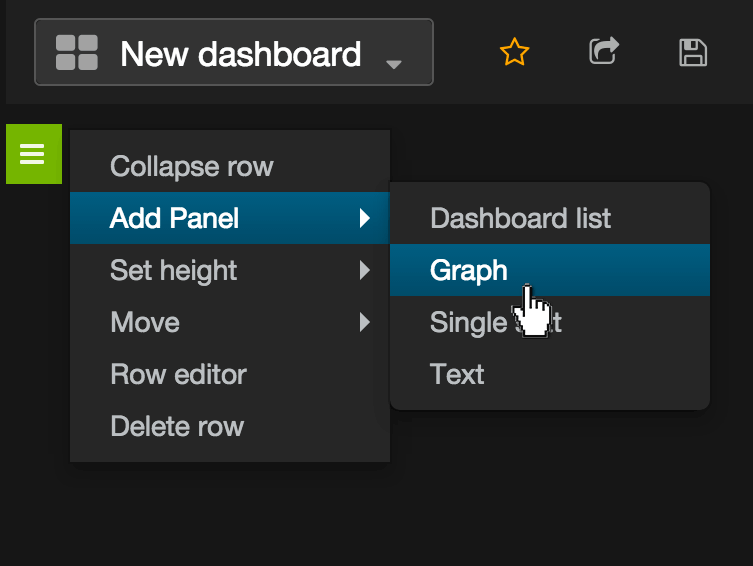
5- Add a New Graph
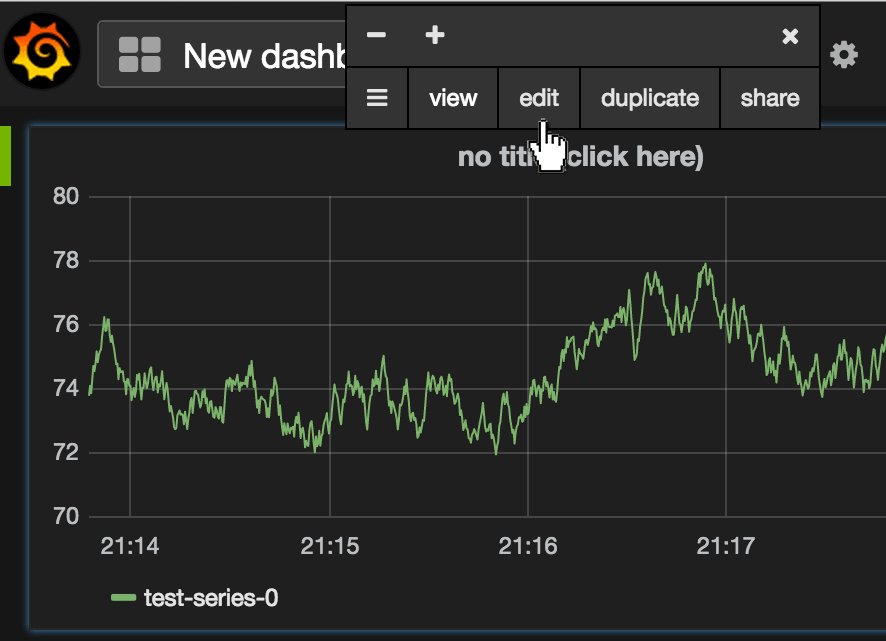
6- Edit the Default Graph
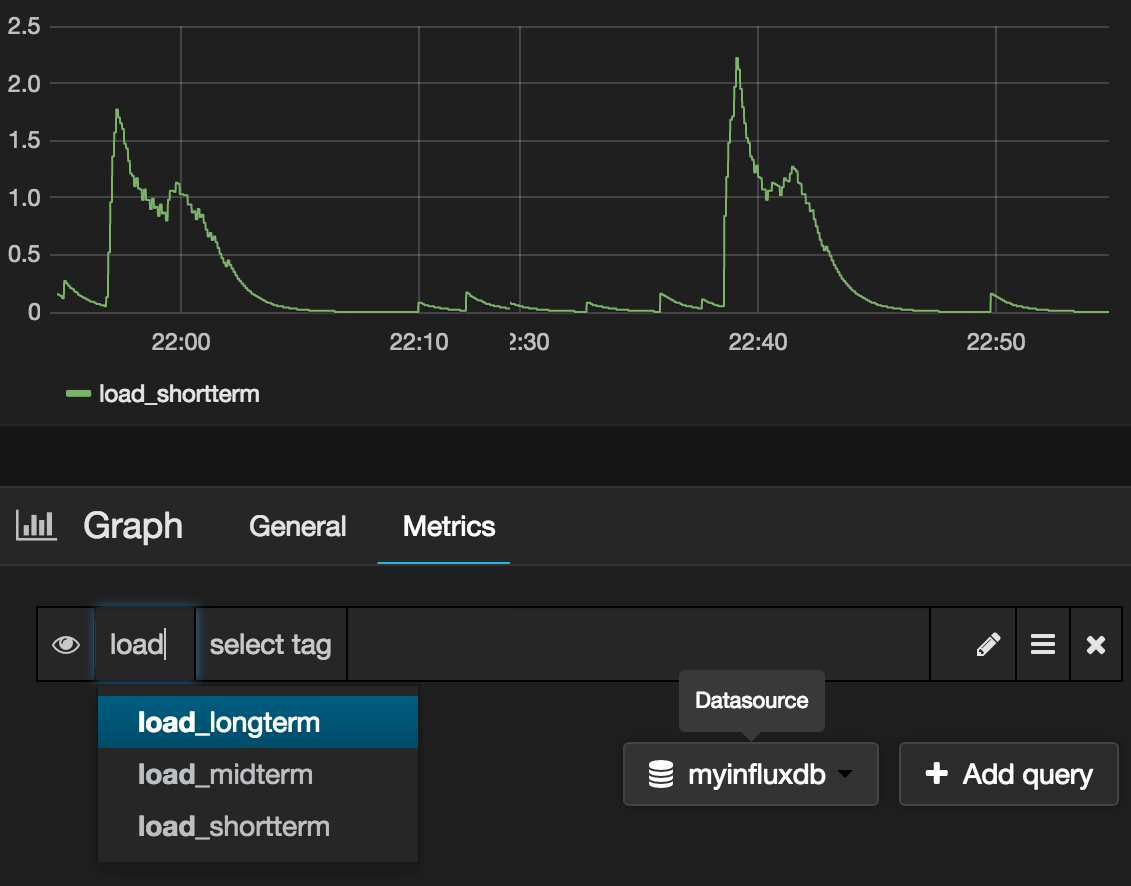
7- Configure the Graph
Monitor & detect anomalies with Anomaly.io
SIGN UP sending...